Fig. C.1
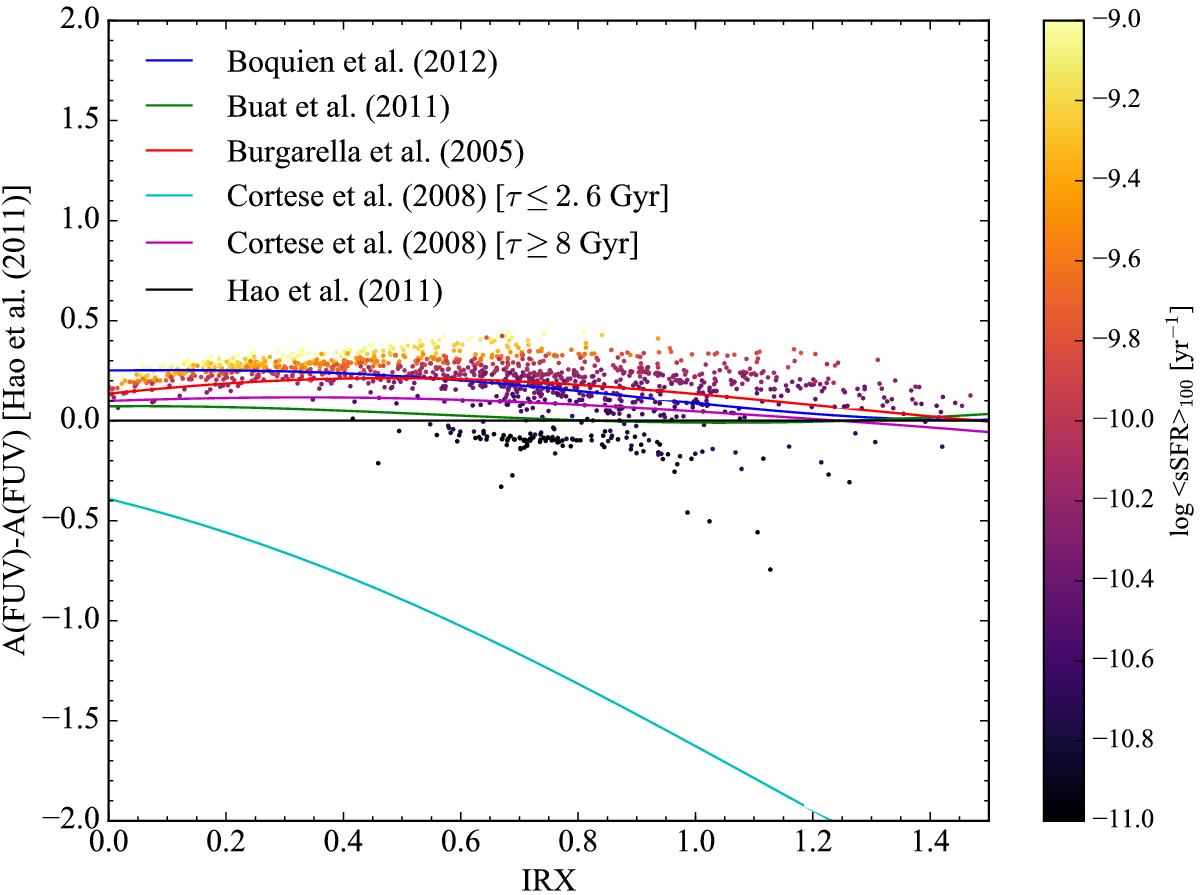
Difference between the FUV attenuation estimated from various methods and from the recipe of Hao et al. (2011) versus IRX. Each line represents a different recipe that depends on IRX: Boquien et al. (2012, blue); Buat et al. (2011, green); Burgarella et al. (2005, red); and Cortese et al. (2008, cyan (τ ≤ 2.6τ ≥ 8. The points represent the difference between the FUV attenuation estimated from CIGALE and Hao et al. (2011). Their colour is indicative of the average sSFR over 100 Myr (⟨sSFR⟩100), following the colour bar on the right.
Current usage metrics show cumulative count of Article Views (full-text article views including HTML views, PDF and ePub downloads, according to the available data) and Abstracts Views on Vision4Press platform.
Data correspond to usage on the plateform after 2015. The current usage metrics is available 48-96 hours after online publication and is updated daily on week days.
Initial download of the metrics may take a while.