Fig. 1
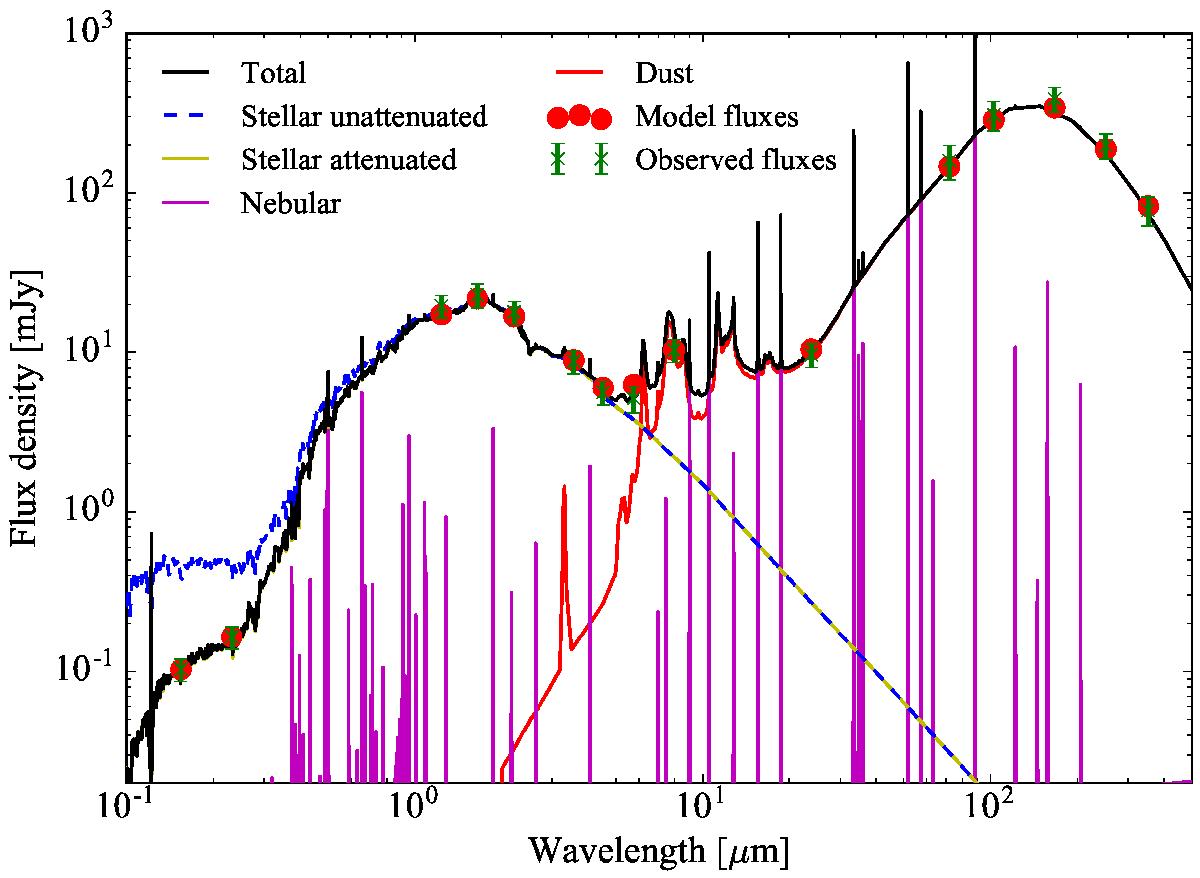
Example of a typical best fit (median reduced χ2 of the best fits for the entire sample). This fit corresponds to a region to the east of NGC 4736. Different components are shown: unattenuated stellar emission (dashed blue line), attenuated stellar emission (yellow line), nebular emission (magenta line), and dust emission (red line). The model fluxes in broadbands are shown as red dots and the observed fluxes as green crosses with their corresponding uncertainties.
Current usage metrics show cumulative count of Article Views (full-text article views including HTML views, PDF and ePub downloads, according to the available data) and Abstracts Views on Vision4Press platform.
Data correspond to usage on the plateform after 2015. The current usage metrics is available 48-96 hours after online publication and is updated daily on week days.
Initial download of the metrics may take a while.