Fig. 5
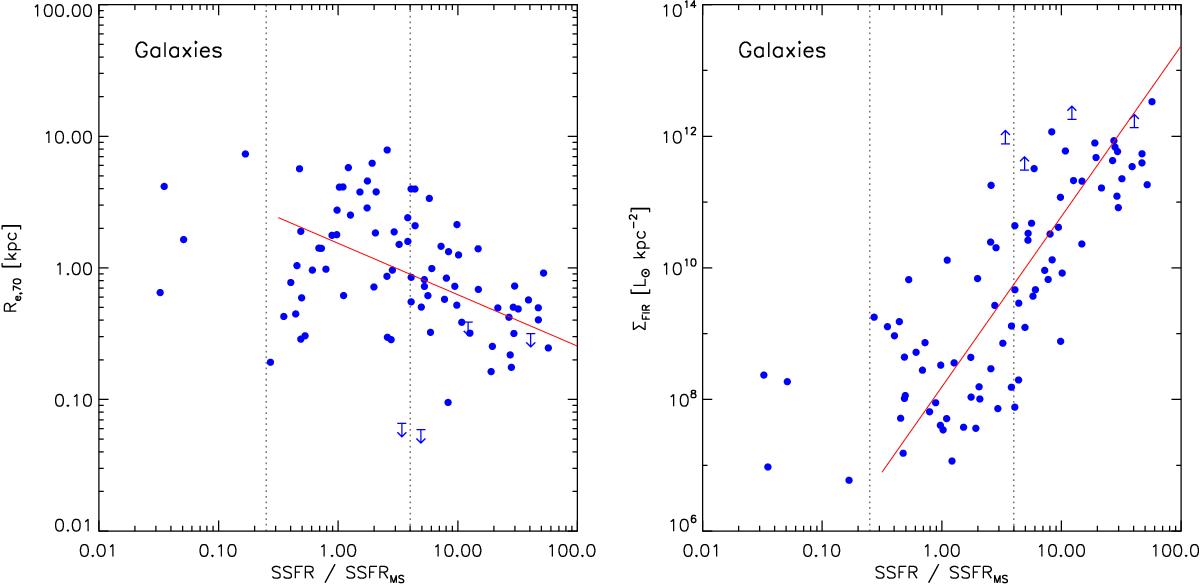
Scalings of FWHM size at 70 μm (left) and of corresponding rest frame FIR surface brightness (right) with distance from the Renzini & Peng (2015) star-forming main-sequence. The figure includes 86 galaxies with published stellar masses. The red line is a power law fit. Vertical dotted lines indicate a range of ±0.6 dex around the main-sequence, as often used to separate main-sequence galaxies from bursting or passive objects.
Current usage metrics show cumulative count of Article Views (full-text article views including HTML views, PDF and ePub downloads, according to the available data) and Abstracts Views on Vision4Press platform.
Data correspond to usage on the plateform after 2015. The current usage metrics is available 48-96 hours after online publication and is updated daily on week days.
Initial download of the metrics may take a while.