Fig. A.4
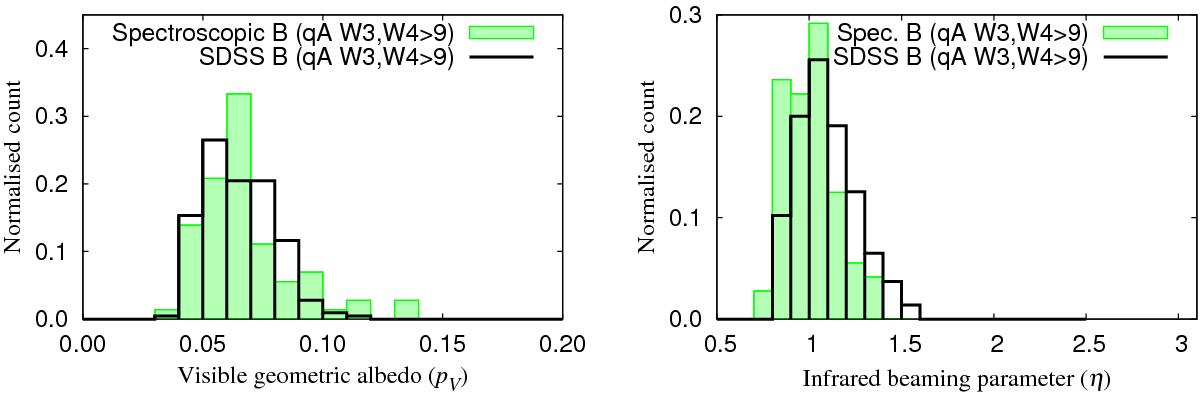
Normalised histograms of parameter value distributions obtained for the restricted, higher quality SDSS and spectroscopic B-types observed by WISE. In this sample, all η-values were obtained from fitting a minimum of ten quality-A data in each of the thermal bands. Left: visible geometric albedo. Right: infrared beaming parameter. For the sake of comparison, the ranges of the axes have been kept the same as in Fig. A.1.
Current usage metrics show cumulative count of Article Views (full-text article views including HTML views, PDF and ePub downloads, according to the available data) and Abstracts Views on Vision4Press platform.
Data correspond to usage on the plateform after 2015. The current usage metrics is available 48-96 hours after online publication and is updated daily on week days.
Initial download of the metrics may take a while.