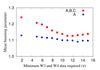
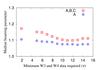
Fig. A.2

Average values of beaming parameter for different subsamples of the SDSS B-types. Left: mean values. Right: median values. The number ν represents the minimum number of points both in W3 and W4 bands required for an object to be part of the sample (see text). Averages corresponding to parameters computed from data with quality flags A, B, or C are plotted in red; the more restrictive case that only allows quality flag A are in blue.
Current usage metrics show cumulative count of Article Views (full-text article views including HTML views, PDF and ePub downloads, according to the available data) and Abstracts Views on Vision4Press platform.
Data correspond to usage on the plateform after 2015. The current usage metrics is available 48-96 hours after online publication and is updated daily on week days.
Initial download of the metrics may take a while.