Fig. 2
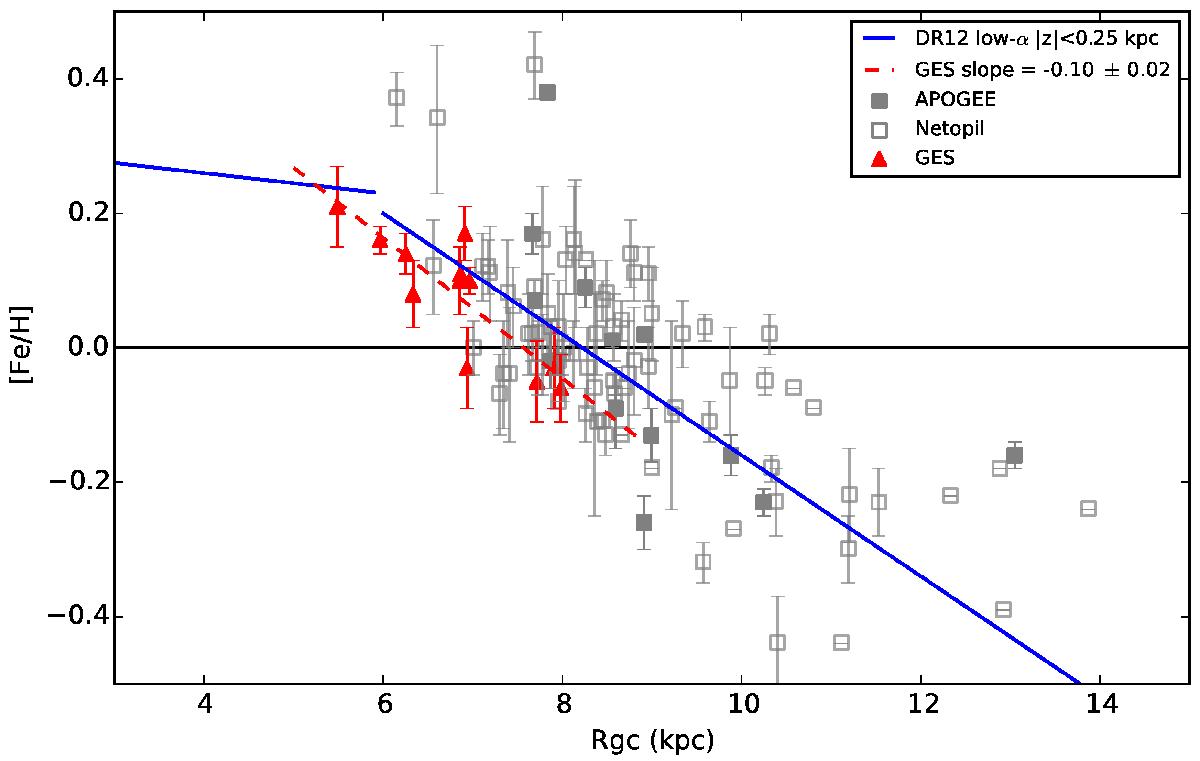
Metallicity gradient as shown by the GES open clusters (red triangles) in comparison to literature studies. The open cluster literature compilation of Netopil et al. (2016) is shown as open gray squares, while clusters observed by the APOGEE survey (Frinchaboy et al. 2013) are filled gray squares. The solid blue line shows the metallicity gradient as determined by APOGEE field giant stars within 250 pc of the Galactic mid-plane (Hayden et al. 2014). The red dashed line is least-squares fit to the GES sample, with the value of the slope given in the caption. [Fe/H] = 0 is indicated by the solid black line, to guide the eye.
Current usage metrics show cumulative count of Article Views (full-text article views including HTML views, PDF and ePub downloads, according to the available data) and Abstracts Views on Vision4Press platform.
Data correspond to usage on the plateform after 2015. The current usage metrics is available 48-96 hours after online publication and is updated daily on week days.
Initial download of the metrics may take a while.