Fig. 6
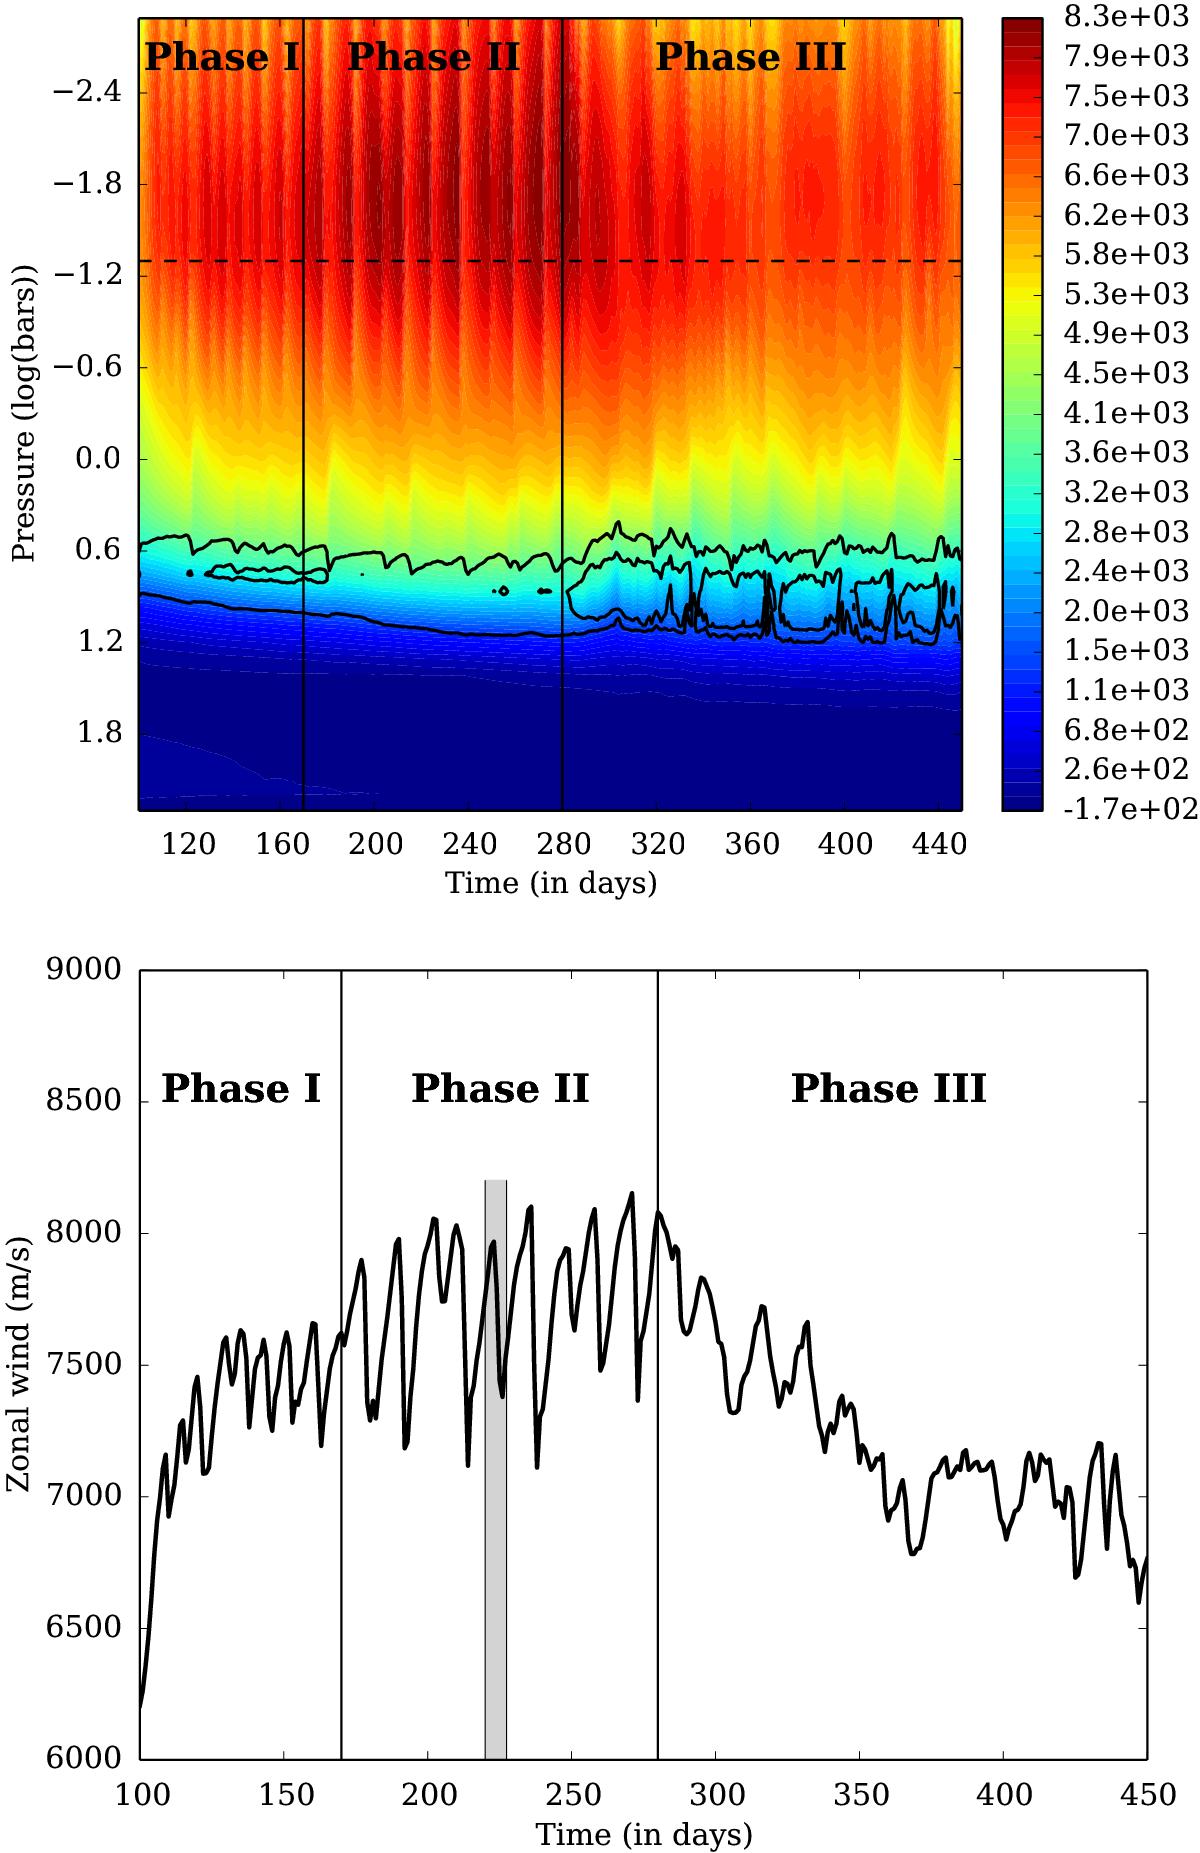
Top: evolution of the vertical profile of the zonally averaged zonal wind at the equator in a time-pressure plane for model HighRes. The horizontal dashed line marks the 50 mbar level. The solid lines are contours of the zonally averaged Richardson number (see text). The contours are for 0.1 (interior contour) and 0.25 (exterior contour). Bottom: time variations of the zonally averaged zonal wind at the equator at the pressure level P = 50 mbar for model HighRes (see text for a discussion of the three phases displayed in both panels).
Current usage metrics show cumulative count of Article Views (full-text article views including HTML views, PDF and ePub downloads, according to the available data) and Abstracts Views on Vision4Press platform.
Data correspond to usage on the plateform after 2015. The current usage metrics is available 48-96 hours after online publication and is updated daily on week days.
Initial download of the metrics may take a while.