Free Access
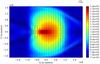
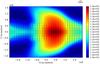
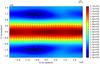
Fig. 3

Time-averaged temperature (color contour) and horizontal wind (arrows) for the low-resolution model at pressure level P = 1.66 mbar (top panel), P = 97 mbar (middle panel) and P = 4.4 bar (bottom panel). The time average is performed from t = 200 days to t = 500 days using 300 snapshots.
This figure is made of several images, please see below:
Current usage metrics show cumulative count of Article Views (full-text article views including HTML views, PDF and ePub downloads, according to the available data) and Abstracts Views on Vision4Press platform.
Data correspond to usage on the plateform after 2015. The current usage metrics is available 48-96 hours after online publication and is updated daily on week days.
Initial download of the metrics may take a while.