Fig. B.1
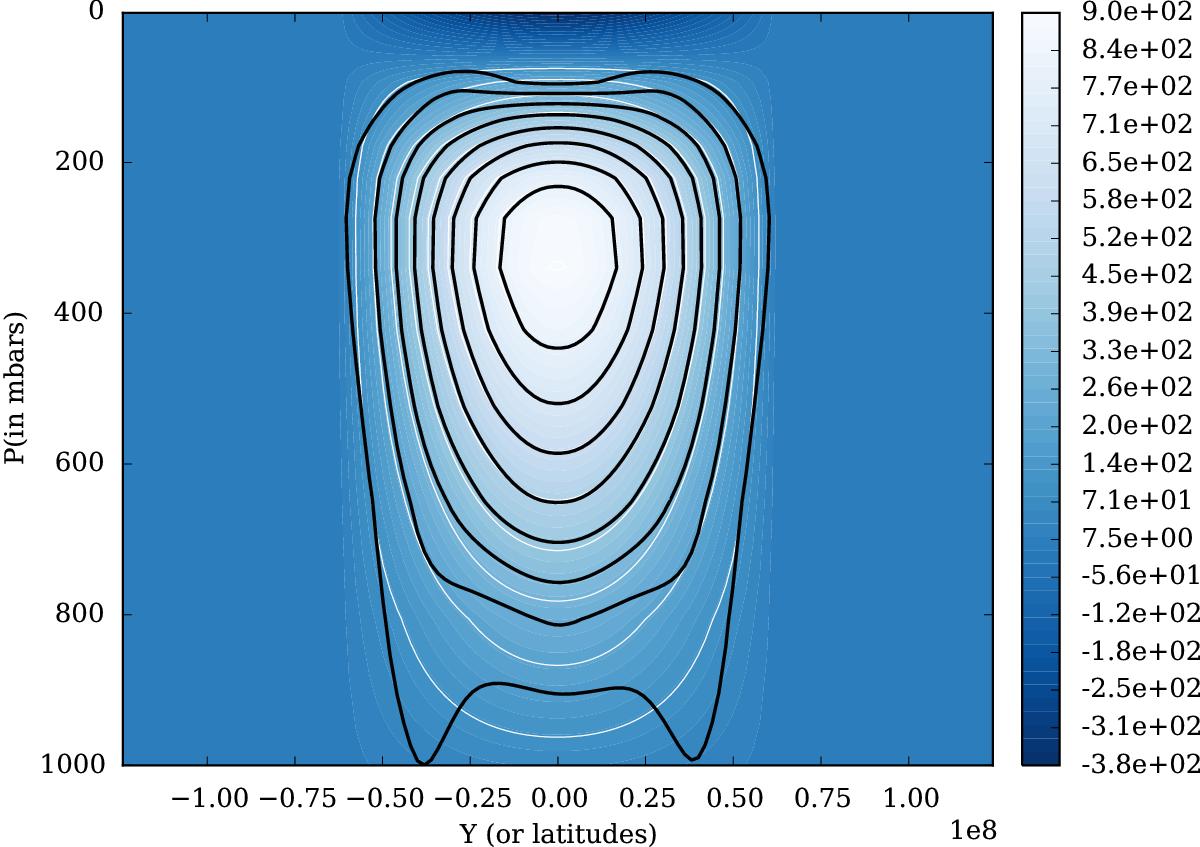
Initial (i.e., at t = 0) zonally averaged zonal wind used for the baroclinic instability simulations (colors and white contours). The black contour show the zonally averaged zonal wind at the end of the simulation for the model with resolution (Nx,Ny,Nz) = (256,128,32). Contours are drawn every 100 m s-1 from 100 to 900 m s-1.
Current usage metrics show cumulative count of Article Views (full-text article views including HTML views, PDF and ePub downloads, according to the available data) and Abstracts Views on Vision4Press platform.
Data correspond to usage on the plateform after 2015. The current usage metrics is available 48-96 hours after online publication and is updated daily on week days.
Initial download of the metrics may take a while.