Fig. 14
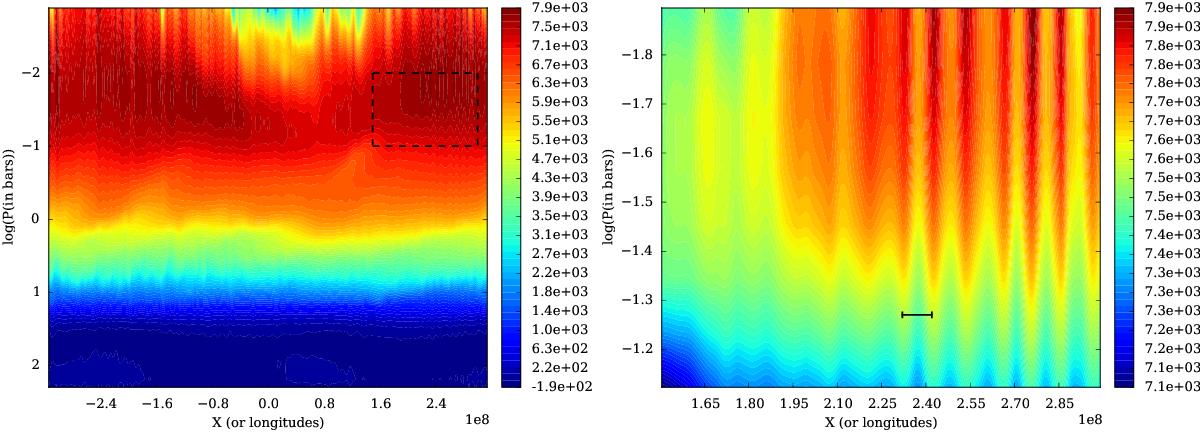
Zonal velocity at the equator in a (x,P) plane at time t = 319 in model HighRes (left panel). Note the high-frequency variations of the velocity (particularly easy to see in the atmosphere upper layers), superposed on the large-scale zonal and vertical variations of the equatorial jet velocity. The right panel shows an enlargement of the dashed box shown in the left panel. The horizontal bar has a length of 10 000 km.
Current usage metrics show cumulative count of Article Views (full-text article views including HTML views, PDF and ePub downloads, according to the available data) and Abstracts Views on Vision4Press platform.
Data correspond to usage on the plateform after 2015. The current usage metrics is available 48-96 hours after online publication and is updated daily on week days.
Initial download of the metrics may take a while.