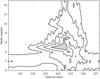
Fig. 11

Left: amplitude of the meridional velocity fluctuations Fourier transform ![]() in the (kx-time) plane for model HighRes, spatially averaged over the region |y| < 5 × 10⁷ m. Contours are for
in the (kx-time) plane for model HighRes, spatially averaged over the region |y| < 5 × 10⁷ m. Contours are for ![]() ,
, ![]() ,
, ![]() and
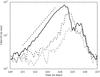
and ![]() . The region surrounding the maximum is filled in gray. Right: same as the left panel, but showing the time evolution of particular modes: kx = 5 (thick solid line), kx = 7 (dashed line,) and kx = 9 (dot-dashed line). The straight dashed line represents an exponential growth with a timescale of one day.
. The region surrounding the maximum is filled in gray. Right: same as the left panel, but showing the time evolution of particular modes: kx = 5 (thick solid line), kx = 7 (dashed line,) and kx = 9 (dot-dashed line). The straight dashed line represents an exponential growth with a timescale of one day.
Current usage metrics show cumulative count of Article Views (full-text article views including HTML views, PDF and ePub downloads, according to the available data) and Abstracts Views on Vision4Press platform.
Data correspond to usage on the plateform after 2015. The current usage metrics is available 48-96 hours after online publication and is updated daily on week days.
Initial download of the metrics may take a while.