Fig. 9
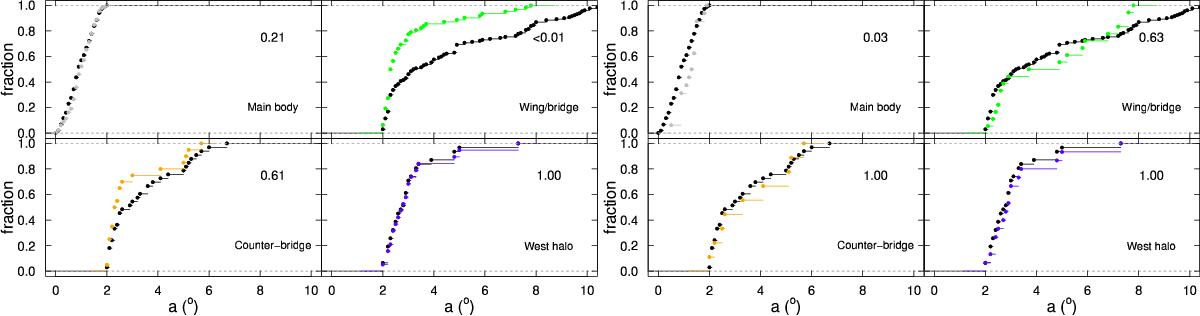
Cumulative distributions of distance to the centre a for each group of the SMC star cluster population: main body, wing and bridge, counter-bridge, and west halo. Left panels show ages, right panels metallicities available in the literature compilation described in the text. Black curves are the distributions of all clusters, and the colour curves represent the clusters with available parameters. The numbers in the panels are the p-values obtained by applying the Kolmogorov-Smirnov test to the black and coloured curves.
Current usage metrics show cumulative count of Article Views (full-text article views including HTML views, PDF and ePub downloads, according to the available data) and Abstracts Views on Vision4Press platform.
Data correspond to usage on the plateform after 2015. The current usage metrics is available 48-96 hours after online publication and is updated daily on week days.
Initial download of the metrics may take a while.