Fig. 5
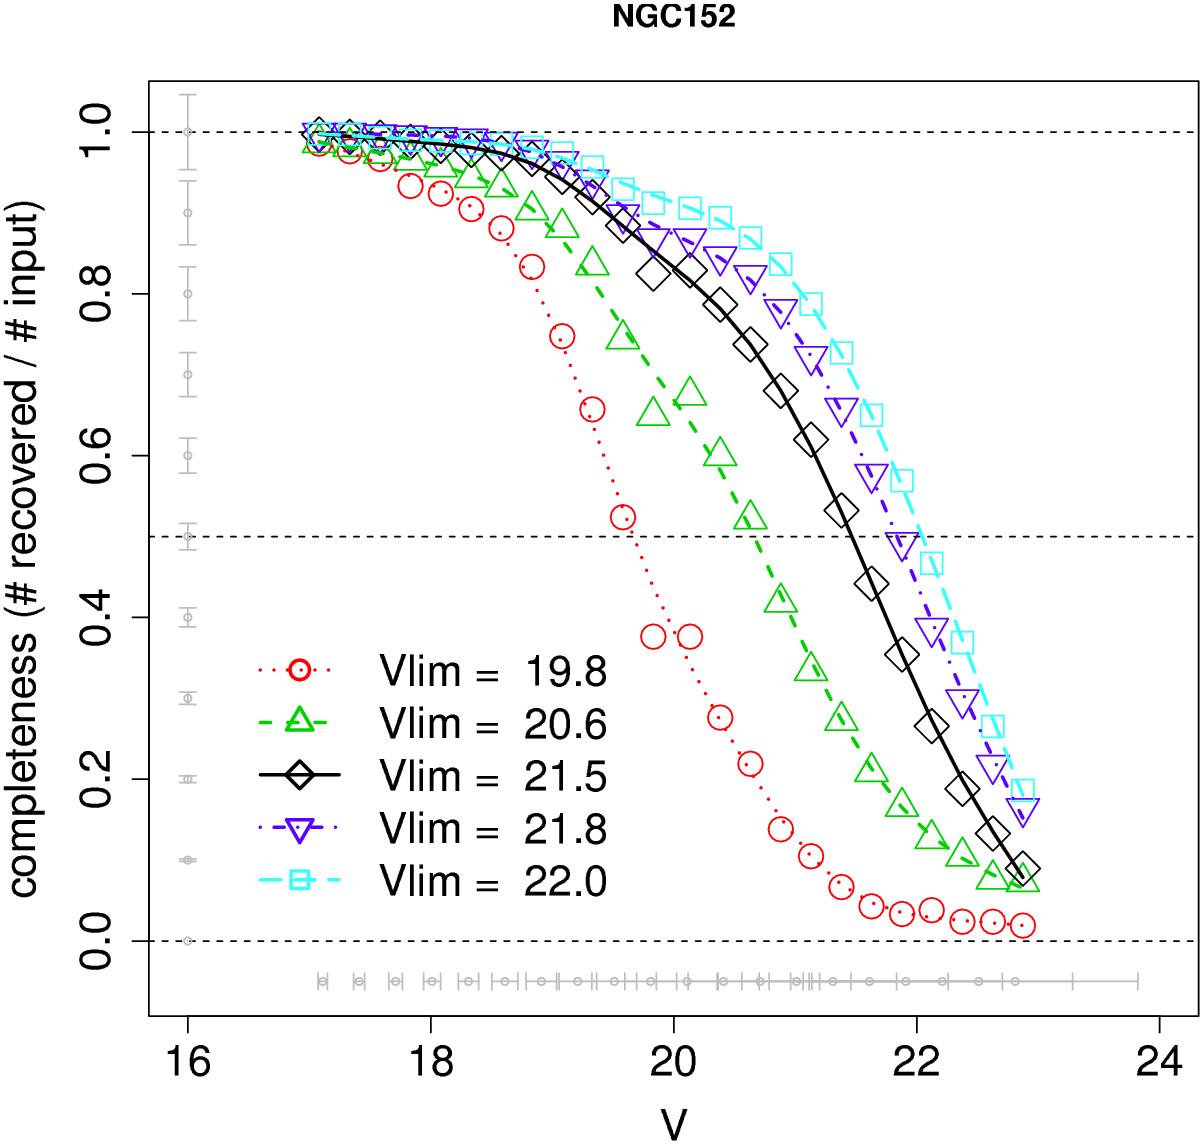
Completeness curves for the reference cluster NGC 152. Different curves represent different annuli around the centre of the cluster in steps of 22″ (from 0′ to 1.8′). The curves in a crescent distance from the cluster centre are represented by red circles and a dotted line, green triangles and a dashed line, black diamonds and solid lines, blue inverted triangles and a dot-dashed line, and cyan squares and a long-dashed line. Uncertainty bars from the artificial star tests are presented in grey. The horizontal black dashed line at completeness level 0.5 marks the intersection with each line whose magnitudes are shown in the legend in each panel.
Current usage metrics show cumulative count of Article Views (full-text article views including HTML views, PDF and ePub downloads, according to the available data) and Abstracts Views on Vision4Press platform.
Data correspond to usage on the plateform after 2015. The current usage metrics is available 48-96 hours after online publication and is updated daily on week days.
Initial download of the metrics may take a while.