Fig. 11
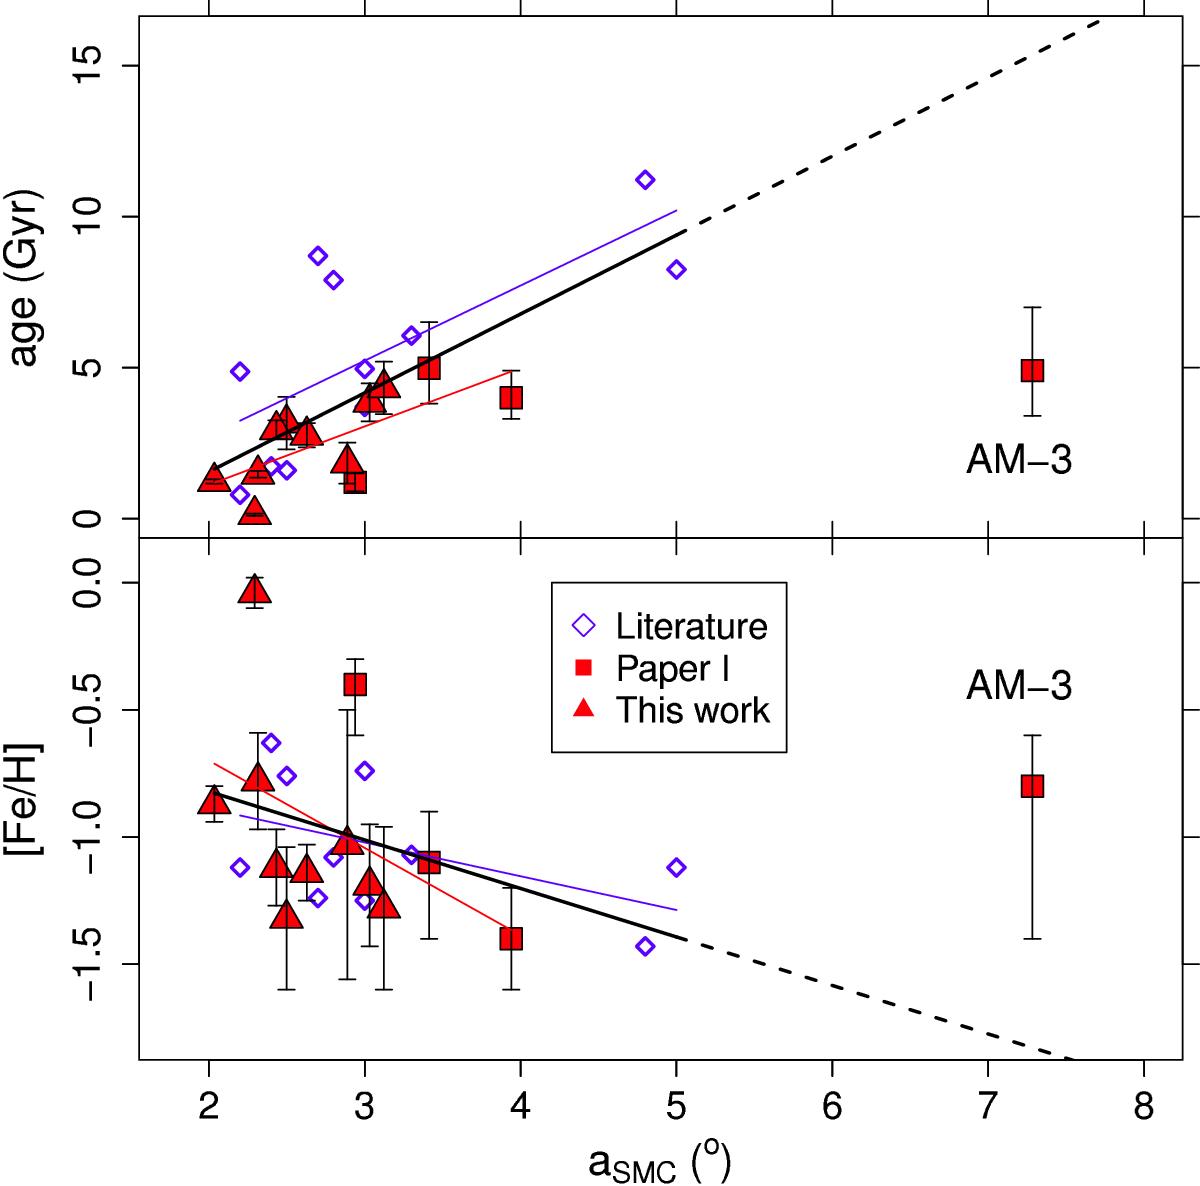
Same as Fig. 10, but only with WH clusters. Blue diamonds are the same literature values as in the previous figure, excluding the clusters in common with our sample to avoid duplicates. Red squares are the results from Paper I for the WH, except AM-3. Red triangles are the results from this work. Blue lines are the linear fits to the literature points, red lines are the linear fits to our data points, and black lines are the linear fits to all points together. The parameters of these fits are presented in Table 6.
Current usage metrics show cumulative count of Article Views (full-text article views including HTML views, PDF and ePub downloads, according to the available data) and Abstracts Views on Vision4Press platform.
Data correspond to usage on the plateform after 2015. The current usage metrics is available 48-96 hours after online publication and is updated daily on week days.
Initial download of the metrics may take a while.