Fig. 10
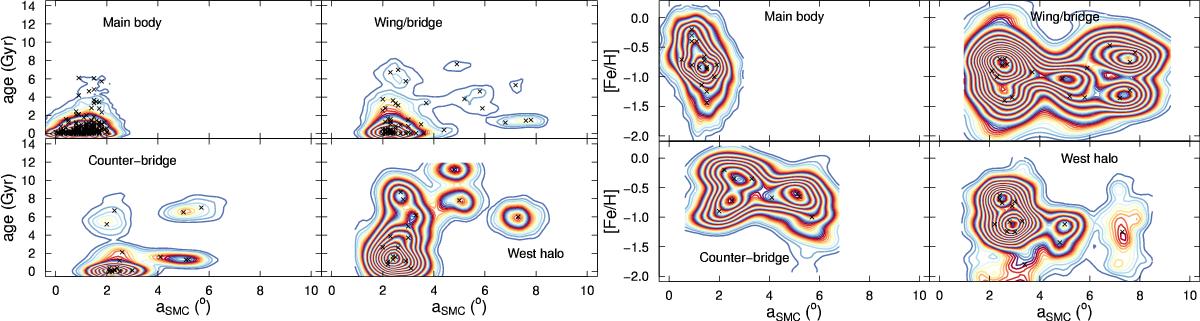
Age and metallicity radial distributions in terms of the semi-major axis a in degrees, as done in Paper I. Age distributions are shown separately for the four components in the left panel, and the equivalent for metallicity is displayed in the right panel. Ages and metallicities are weighted averages from literature data as explained in the text. No results from this work are included here. Contours are the density maps considering a two-dimensional Gaussian around each point using their uncertainties. See text for details.
Current usage metrics show cumulative count of Article Views (full-text article views including HTML views, PDF and ePub downloads, according to the available data) and Abstracts Views on Vision4Press platform.
Data correspond to usage on the plateform after 2015. The current usage metrics is available 48-96 hours after online publication and is updated daily on week days.
Initial download of the metrics may take a while.