Fig. 5
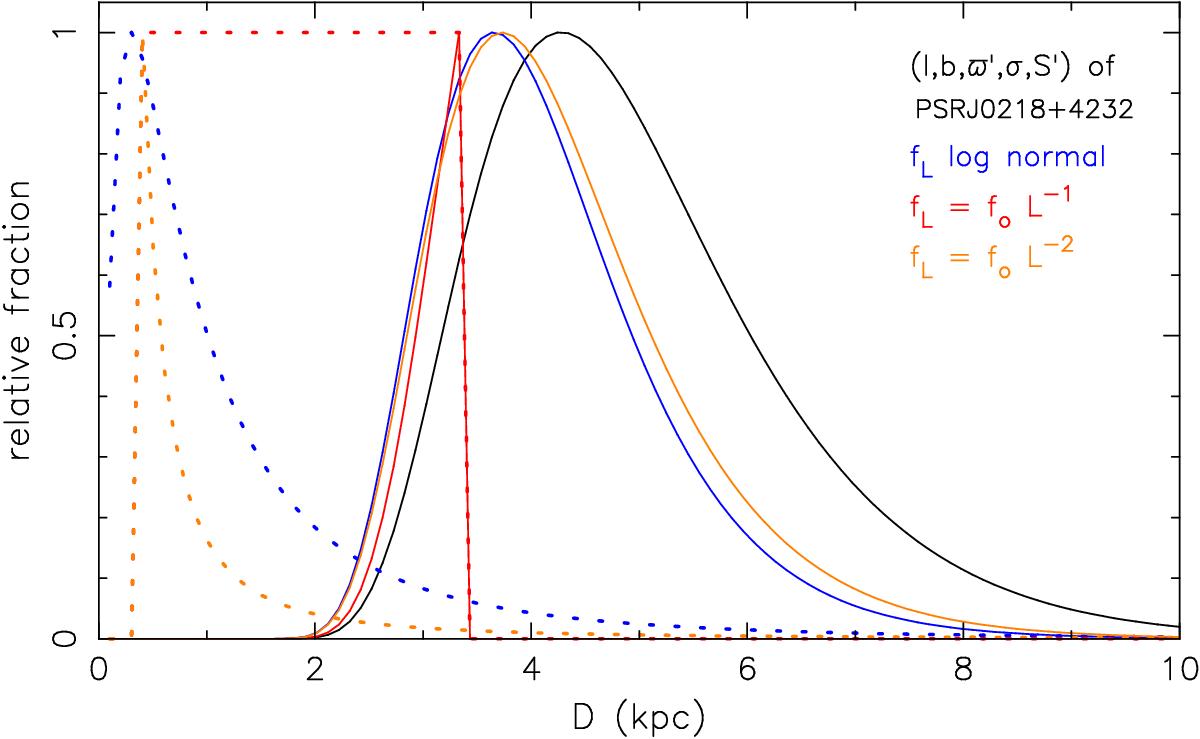
Distance probability function determined from parallax and accurate flux with known spatial and luminosity distributions. The black line gives the values based on parallax alone (reproducing the black line in Fig. 3). For a lognormal luminosity function, the dashed blue line shows the extra term D2fL(LoD2S′) and the solid blue line the overall distribution according to Eq. (24) for values appropriate for PSR J0218+4232. The dashed and solid red lines and the brown lines idem for power-law luminosity functions both with Lmin = 0.1 mjy kpc2 and Lmax = 10 mJy kpc2 for α = −1, and Lmax = 100 mJy kpc2 for α = −2, respectively. All curves are normalized to their maximum value.
Current usage metrics show cumulative count of Article Views (full-text article views including HTML views, PDF and ePub downloads, according to the available data) and Abstracts Views on Vision4Press platform.
Data correspond to usage on the plateform after 2015. The current usage metrics is available 48-96 hours after online publication and is updated daily on week days.
Initial download of the metrics may take a while.