Fig. 3
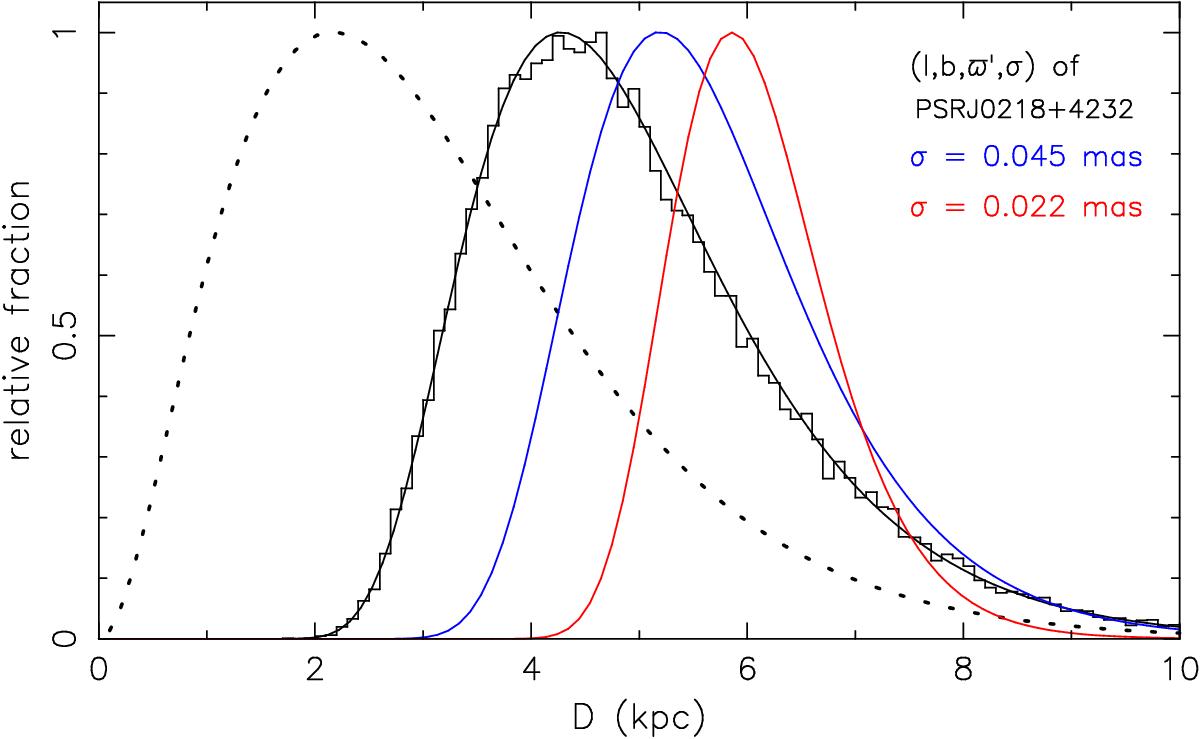
For an assumed galactocentric distribution of objects, the distribution as a function of distance to the Earth is given by Eqs. (4) and (6), illustrated for the direction towards PSR J0218+4232 with the dotted line. The black smooth line gives the probability distribution of actual distances in this direction for the measured parallax of this pulsar, according to Eq. (20) in the approximation CD(0,∞) ≃ CD(0,Dmax), Dmax = 10 kpc. The histogram gives the results of a Monte Carlo simulation which retains objects with 0.14 <ϖ′< 0.18. The blue and red lines give the analytic distributions for hypothetically smaller measurement errors but the same value for ϖ′. The curves are normalized to the same maximum value.
Current usage metrics show cumulative count of Article Views (full-text article views including HTML views, PDF and ePub downloads, according to the available data) and Abstracts Views on Vision4Press platform.
Data correspond to usage on the plateform after 2015. The current usage metrics is available 48-96 hours after online publication and is updated daily on week days.
Initial download of the metrics may take a while.