Fig. 1
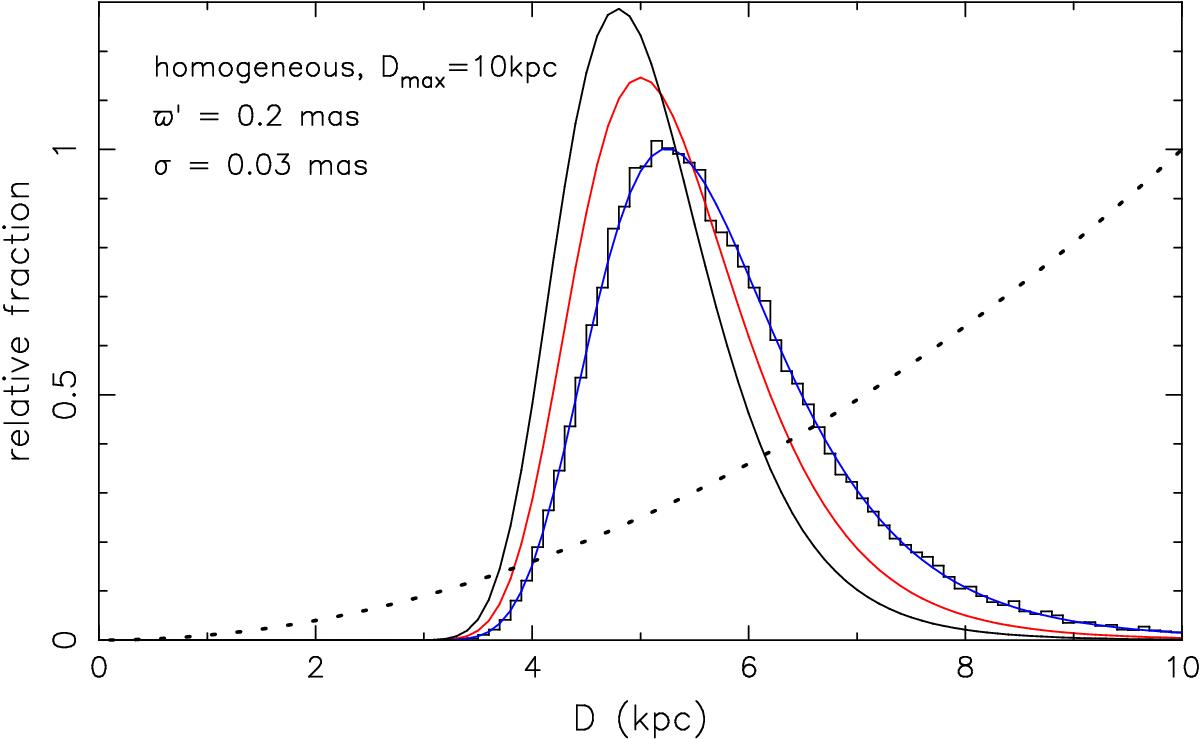
Probability distribution of actual distances for a measured parallax for objects distributed homogeneously in a finite sphere for values of ϖ′, σ, and Dmax as indicated. The blue line represents Eq. (18). The histogram gives the results of a Monte Carlo simulation which retains objects with 0.198 <ϖ′< 0.202. The black and red lines represent modified versions of Eq. (18) according to Faucher-Giguère & Kaspi (2006) and Verbiest et al. (2012), respectively. The intrinsic distribution given by Eqs. (4) and (5) is shown as a dashed line. All curves are normalized to the same area under the curve.
Current usage metrics show cumulative count of Article Views (full-text article views including HTML views, PDF and ePub downloads, according to the available data) and Abstracts Views on Vision4Press platform.
Data correspond to usage on the plateform after 2015. The current usage metrics is available 48-96 hours after online publication and is updated daily on week days.
Initial download of the metrics may take a while.