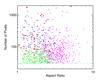
Fig. 5
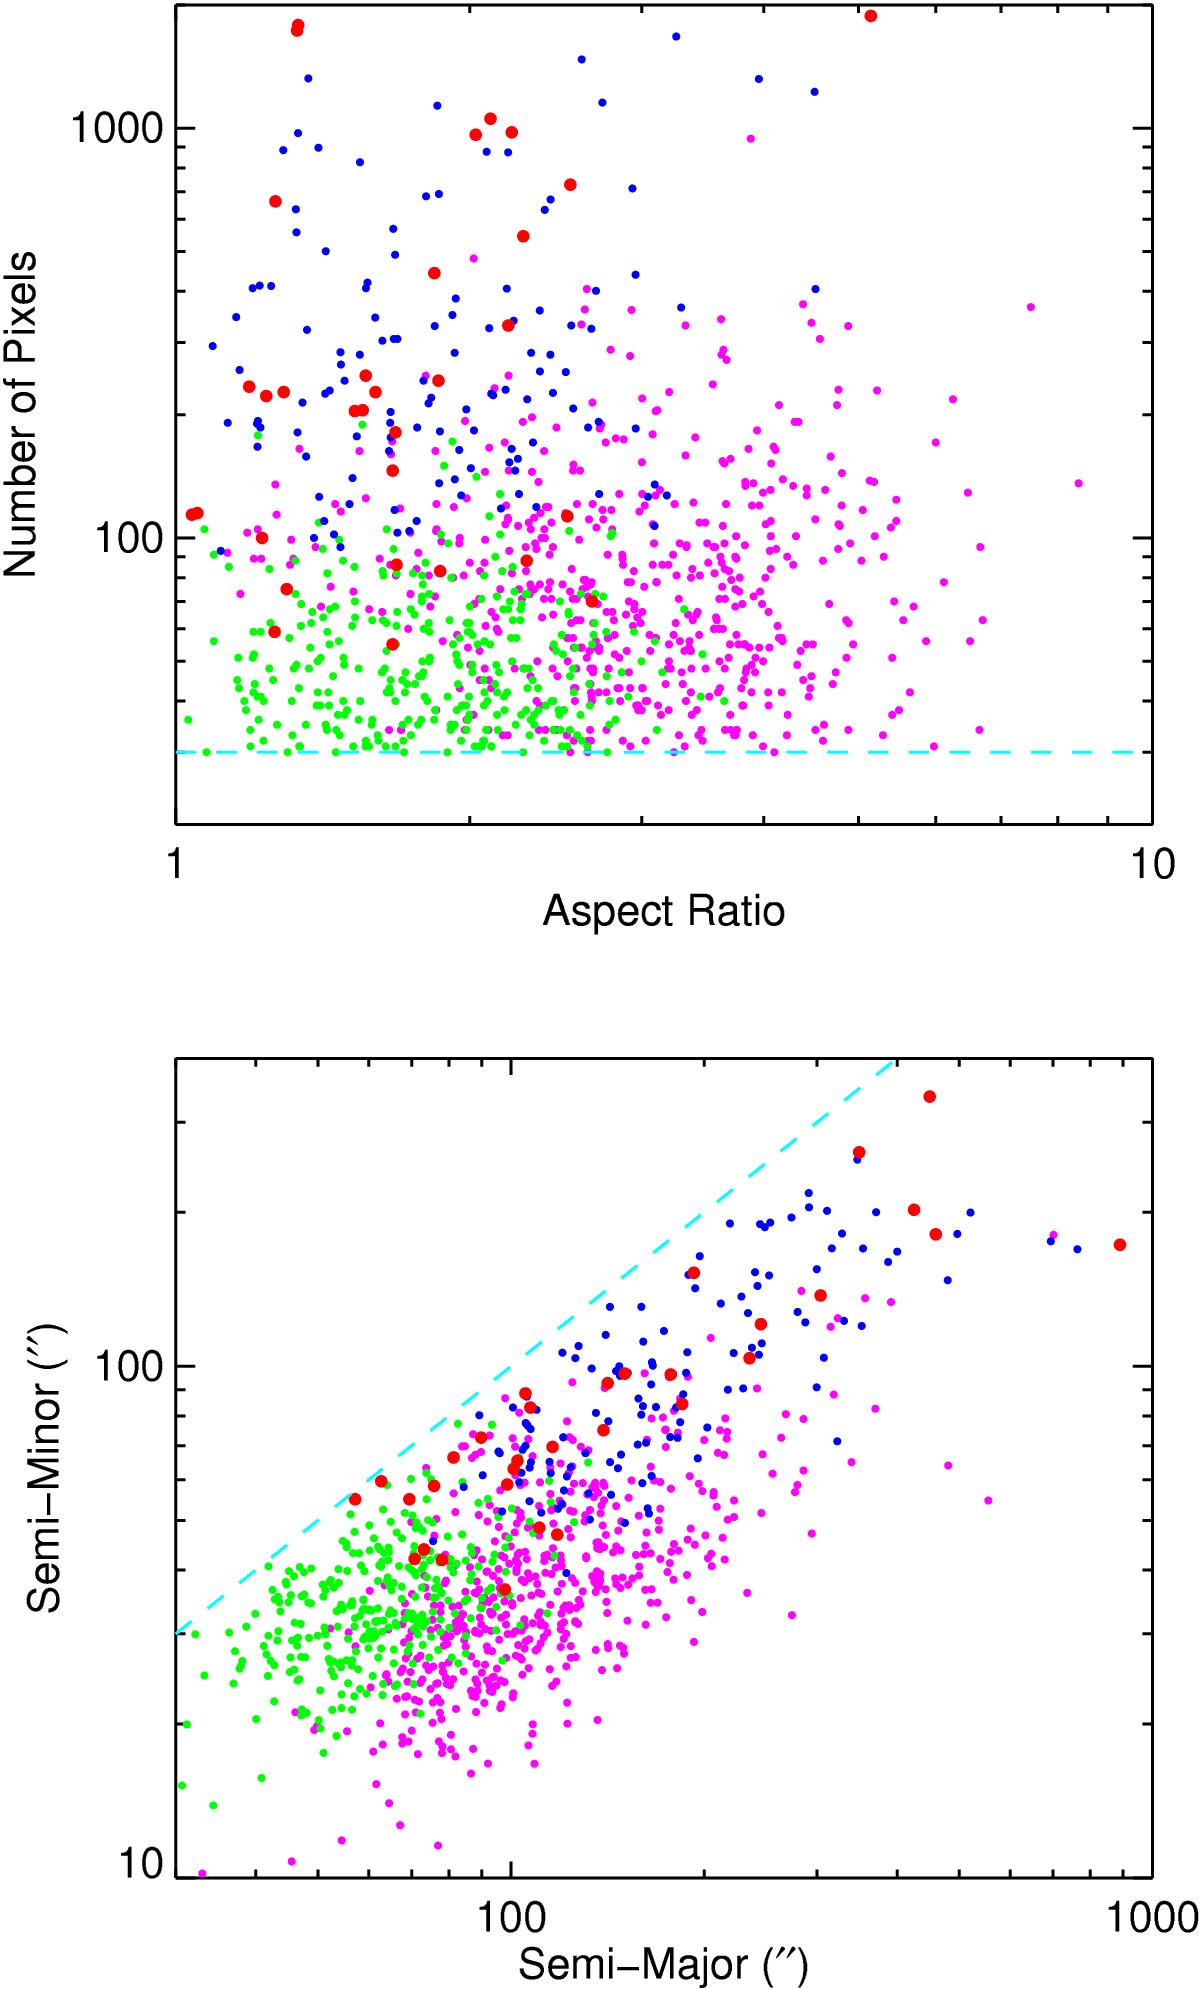
Observed properties of the different structure types identified in Sect. 3. These plots show the distributions of angular sizes, number of associated spine points and shapes of the elongated structures, filaments, networks of filaments and complexes, which are shown as filled green, magenta, blue and red circles, respectively. For clarity we have excluded the marginally resolved structures as there is significant overlap with the elongated structures. The horizontal dashed line shown in the upper panel indicates the threshold of thirty pixels required for inclusion in the catalogue while the diagonal dashed line shown in the lower panel shows the line of equality where the semi-major and semi-minor axes are equal.
Current usage metrics show cumulative count of Article Views (full-text article views including HTML views, PDF and ePub downloads, according to the available data) and Abstracts Views on Vision4Press platform.
Data correspond to usage on the plateform after 2015. The current usage metrics is available 48-96 hours after online publication and is updated daily on week days.
Initial download of the metrics may take a while.