Fig. 4
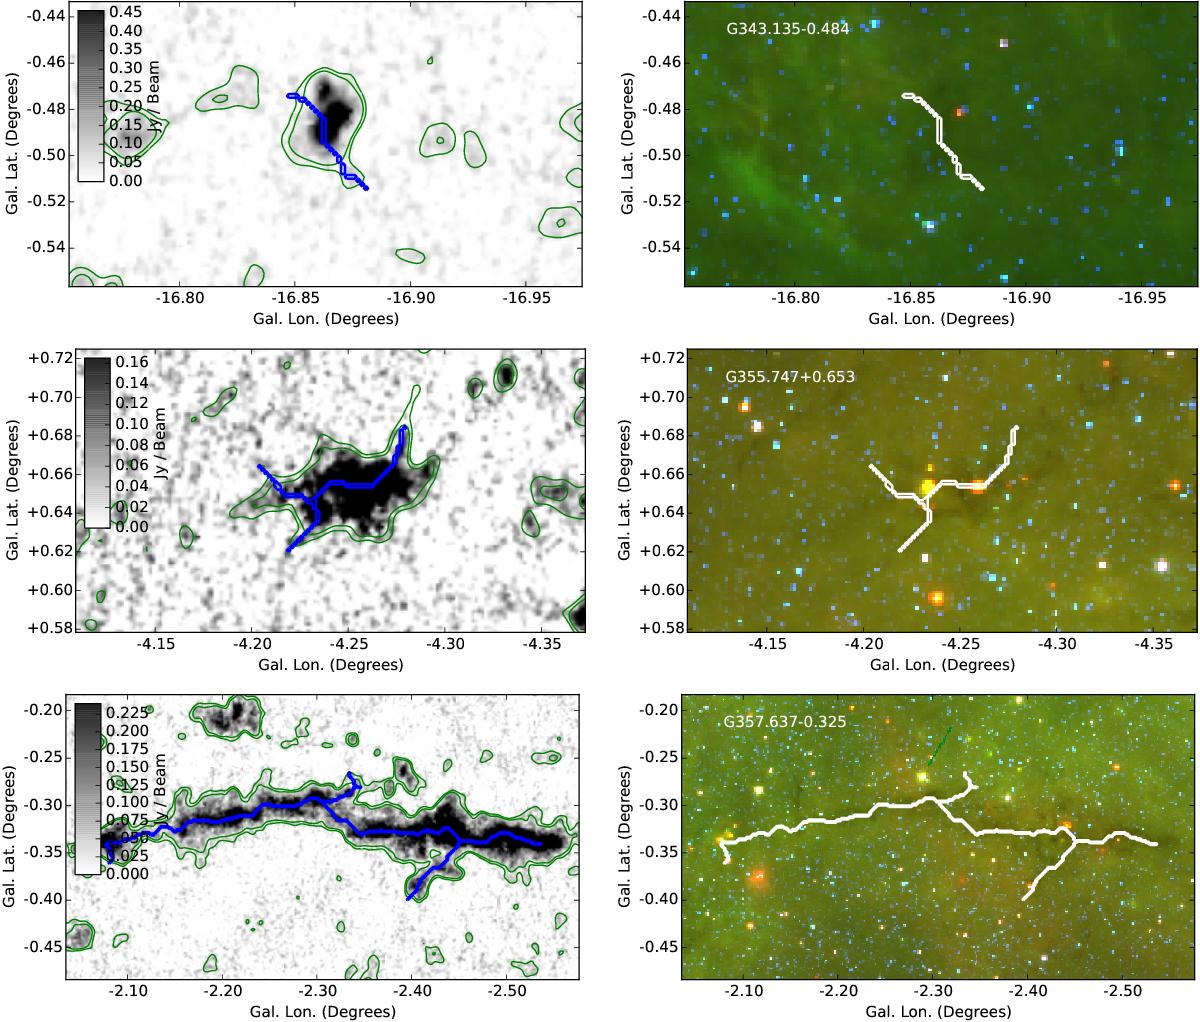
Examples of the different structure types identified. The dust continuum images are presented in the left hand panels while in the right hand panels we present three colour composite mid-infrared images; they are produced using the 4.5, 8.0 μm IRAC bands taken from the GLIMPSE survey (Benjamin et al. 2003; Churchwell et al. 2009) and the 24 μm MIPS band image extracted from the MIPSGAL survey (Carey et al. 2005). The green contours show the 3 and 5σ noise levels. The blue and white lines overlaid on the left and right panels trace the skeletons of the structures identified by the DisPerSE algorithm. In the upper, middle and lower panels we show an example of an marginally resolved clumps, a marginally resolved elongated structure and a filament, respectively.
Current usage metrics show cumulative count of Article Views (full-text article views including HTML views, PDF and ePub downloads, according to the available data) and Abstracts Views on Vision4Press platform.
Data correspond to usage on the plateform after 2015. The current usage metrics is available 48-96 hours after online publication and is updated daily on week days.
Initial download of the metrics may take a while.