Fig. 23
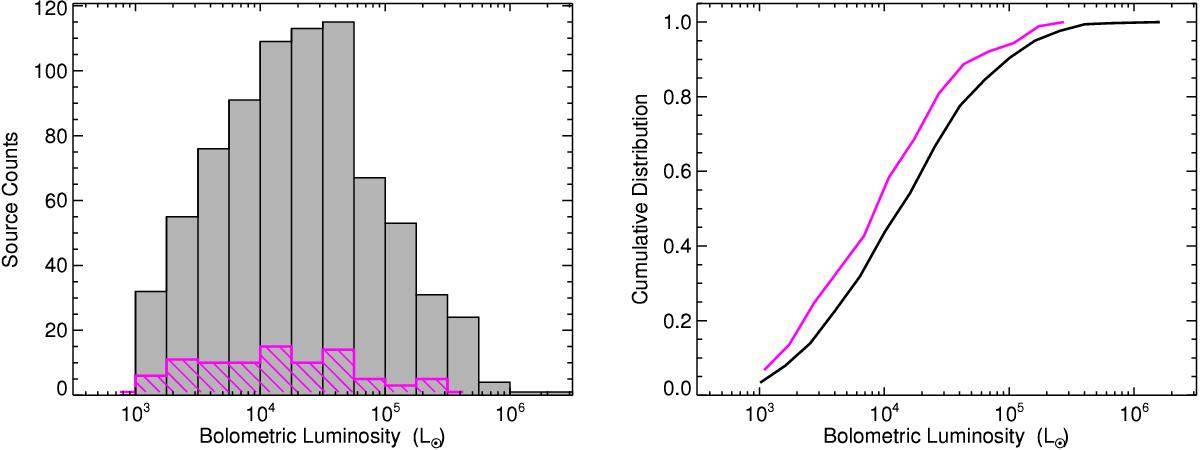
Luminosity distribution of H ii regions and MYSOs associated with the filaments. The left hand panel shows the distribution of all H ii regions and MYSOs in the ATLASGAL region identified by the RMS survey (grey histogram) and those associated with a filament (magenta hatched histogram). The right hand panel shows the cumulative distribution of the luminosity for all massive RMS sources (black curve) and those associated with the filaments identified in this paper.
Current usage metrics show cumulative count of Article Views (full-text article views including HTML views, PDF and ePub downloads, according to the available data) and Abstracts Views on Vision4Press platform.
Data correspond to usage on the plateform after 2015. The current usage metrics is available 48-96 hours after online publication and is updated daily on week days.
Initial download of the metrics may take a while.