Fig. 20
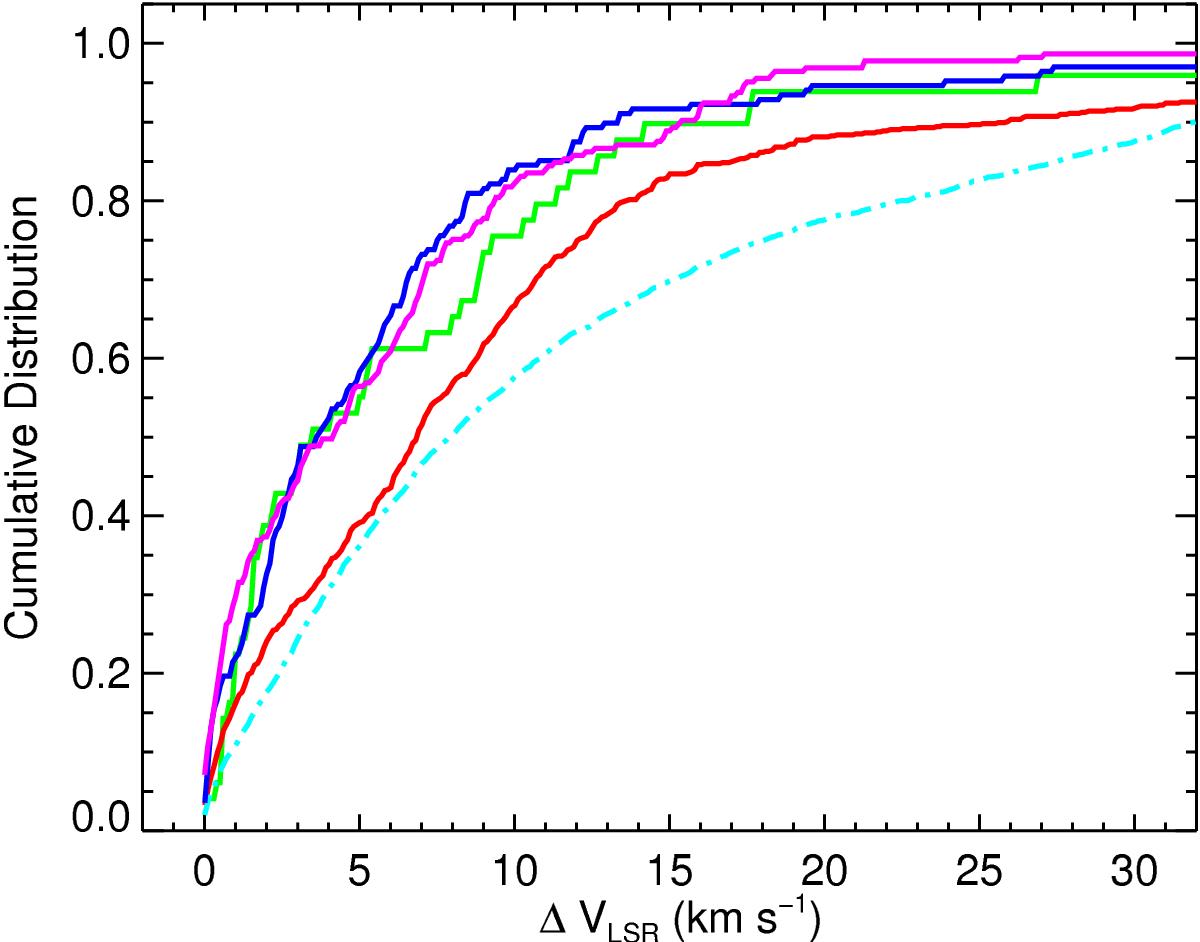
Cumulative distribution of separation in velocity of filaments and molecular clouds and their nearest spiral arm long the line of sight (|ΔV|). The spiral arm velocities are those shown in Fig. 11. The |ΔV| distribution of the filaments is shown by the magenta curve, which is compared to H ii regions shown in blue, the 50 most massive GRS clouds shown in green and the rest of the GRS lower mass cloud population, which is shown in red. The cyan curve traces the |ΔV| distribution determined from a Monte Carlo simulated sample of clouds with random velocities.
Current usage metrics show cumulative count of Article Views (full-text article views including HTML views, PDF and ePub downloads, according to the available data) and Abstracts Views on Vision4Press platform.
Data correspond to usage on the plateform after 2015. The current usage metrics is available 48-96 hours after online publication and is updated daily on week days.
Initial download of the metrics may take a while.