Fig. 2
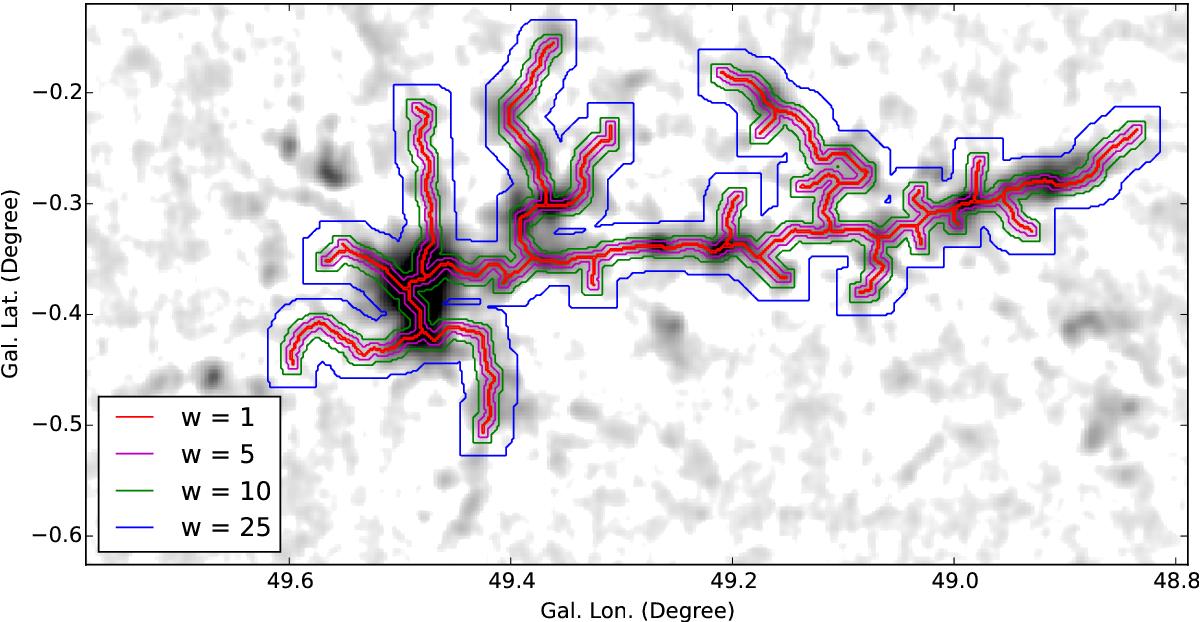
Demonstration of the dilation operation applied to thesource skeleton identified towards the W51 molecular cloud. The grayscale image shows the dust continuum emission mapped with ATLASGAL while surrounding contours show how the size and shape of thedilated skeleton changes as it is dilated by squares of increasing sizes. The red contour shows a dilation by a square of 1 pixel and simply traces the original skeleton as this also has a width of 1 pixel. The pink, green, blue contours show the structure after the original skeleton has been dilated with a square of width of w = 5, 10 and 25 pixels, respectively.
Current usage metrics show cumulative count of Article Views (full-text article views including HTML views, PDF and ePub downloads, according to the available data) and Abstracts Views on Vision4Press platform.
Data correspond to usage on the plateform after 2015. The current usage metrics is available 48-96 hours after online publication and is updated daily on week days.
Initial download of the metrics may take a while.