Fig. 18
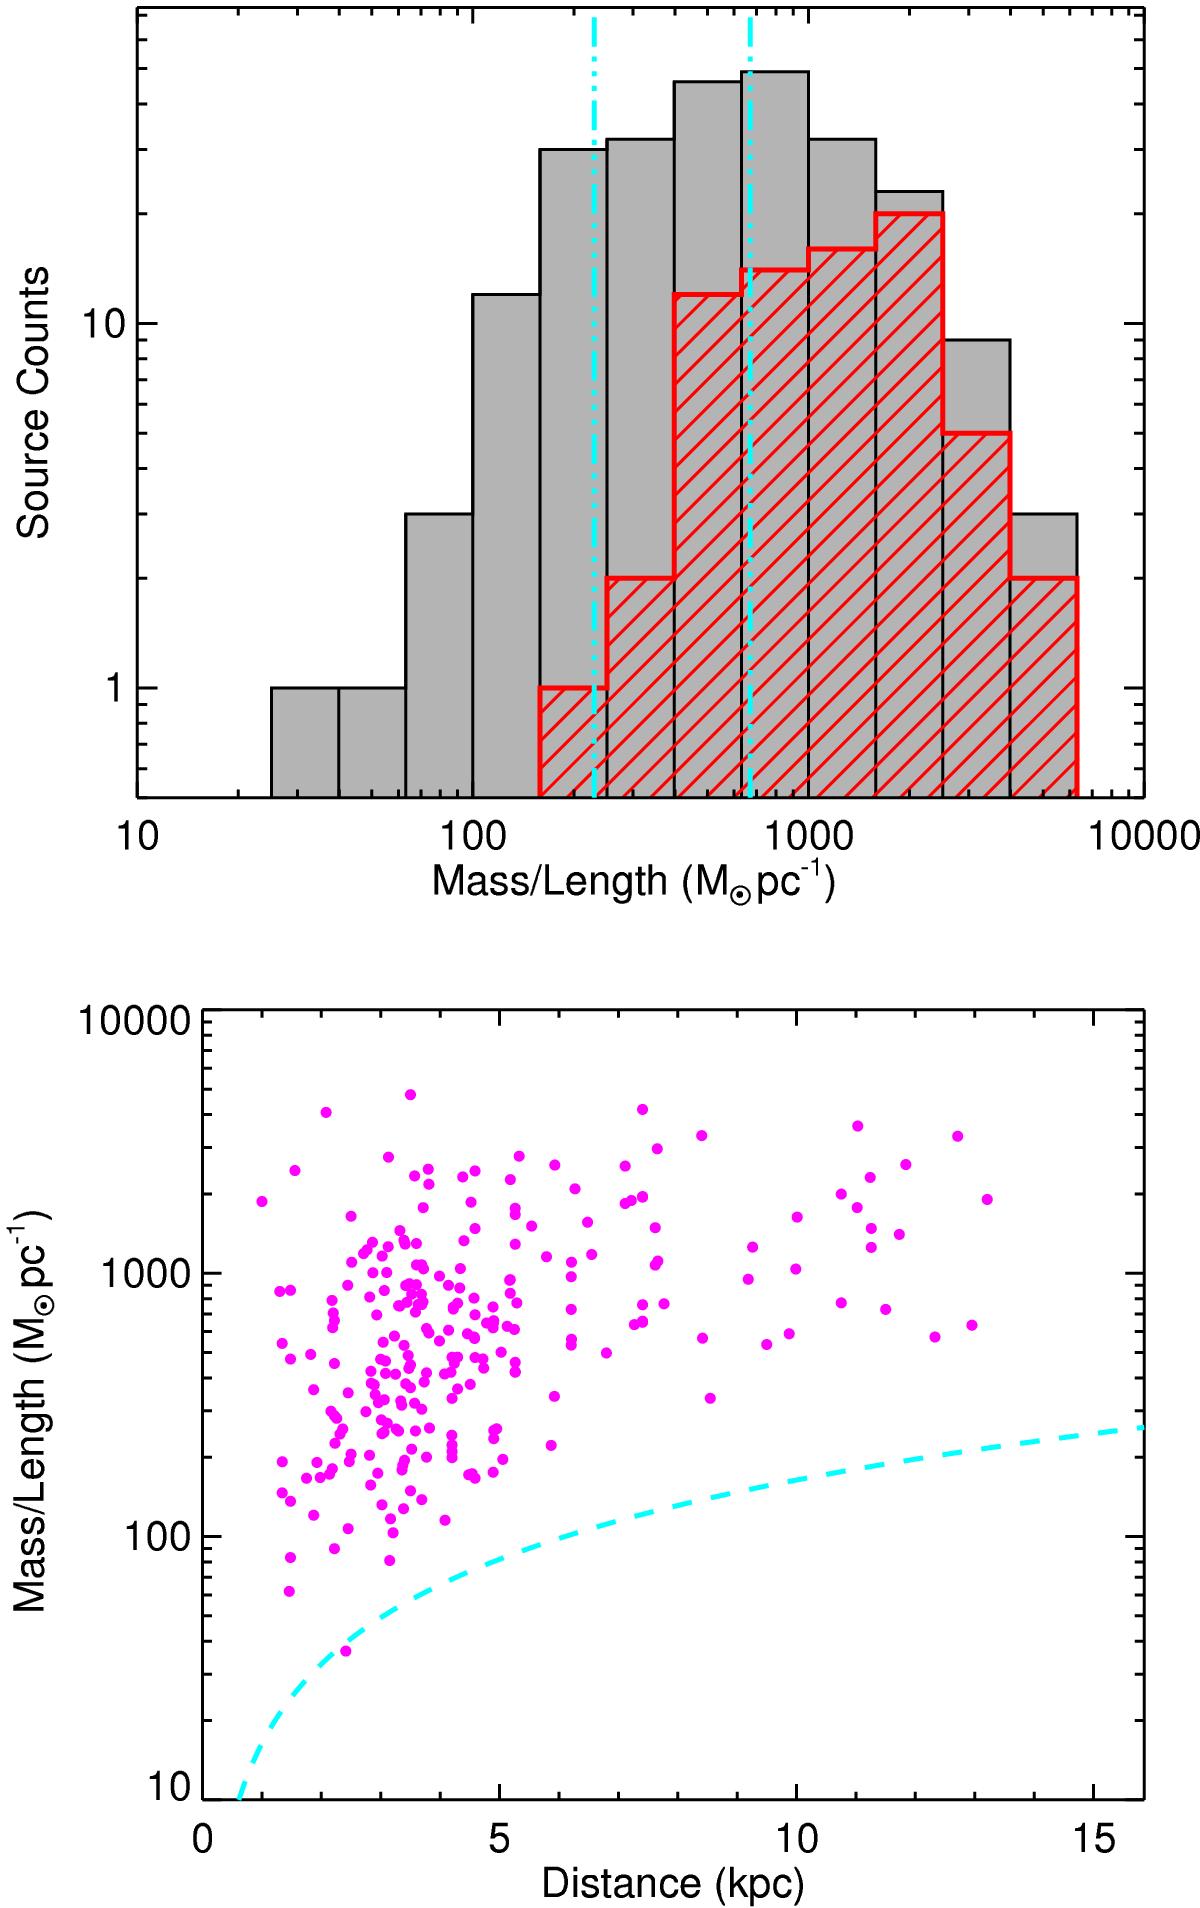
Upper panel: mass-to-length (M/L) ratio for all filaments and for those associated with massive star forming clumps are shown as grey and red hatched histograms, respectively. The vertical cyan lines show the critical M/L thresholds for filaments with line-widths of 0.7 and 1.2 km s-1; this corresponds to masses per unit length of 230 and 670 M⊙ pc-1, respectively. Filaments above these thresholds are unstable to radial collapse (see Sect. 5.5 for details). The bin size is 0.2 dex. Lower panel: the mass-to-length ratio is plotted as a function of heliocentric distance; the dashed cyan curve in this plot indicates the sensitivity of the ATLASGAL survey.
Current usage metrics show cumulative count of Article Views (full-text article views including HTML views, PDF and ePub downloads, according to the available data) and Abstracts Views on Vision4Press platform.
Data correspond to usage on the plateform after 2015. The current usage metrics is available 48-96 hours after online publication and is updated daily on week days.
Initial download of the metrics may take a while.