Fig. 11
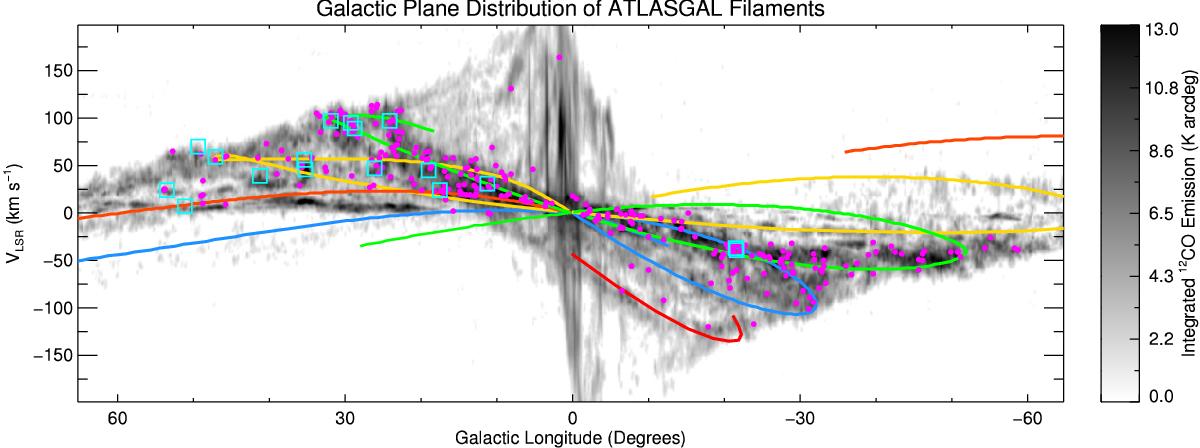
Galactic longitude-velocity distribution of all filaments. The background image shows the distribution of molecular gas as traced by the integrated 12CO (1-0) emission (Dame et al. 2001); the colour bar on the right shows the relative intensity of the emission. The magenta circles mark the positions of the ATLASGAL filaments while the cyan squares show the positions of other filamentary structures reported in the literatures (see Sect. 5.1 for details). The coloured lines trace the location of the spiral arms taken from the model by Taylor & Cordes (1993) and updated by Cordes (2004). The blue, green, yellow and orange curves trace the Norma, Scutum-Centaurus, Sagittarius and Perseus arms, which are the four main spiral arms, while the red curve tracers the Near 3-kpc expanding arm (Bronfman et al. 2000).
Current usage metrics show cumulative count of Article Views (full-text article views including HTML views, PDF and ePub downloads, according to the available data) and Abstracts Views on Vision4Press platform.
Data correspond to usage on the plateform after 2015. The current usage metrics is available 48-96 hours after online publication and is updated daily on week days.
Initial download of the metrics may take a while.