Free Access
Fig. 10
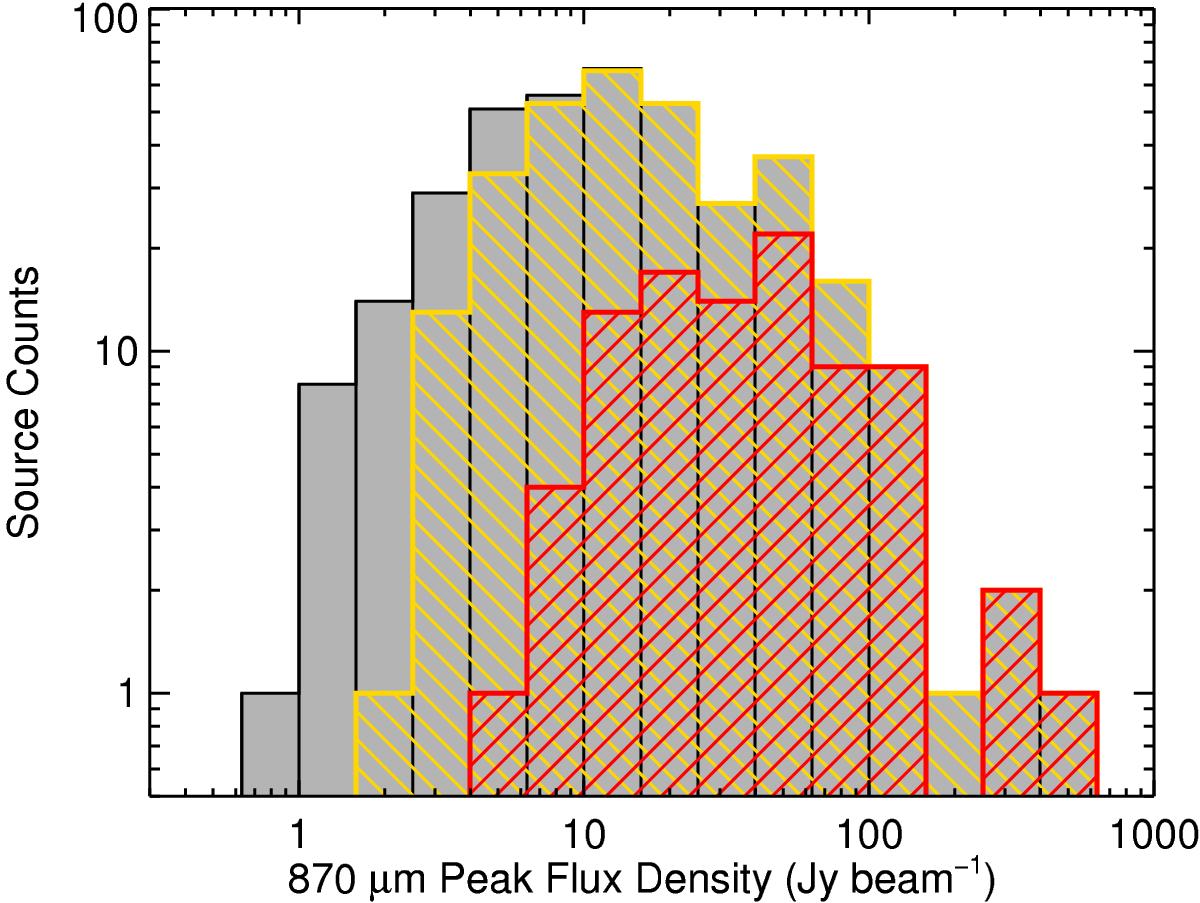
Integrated flux distribution of all filaments is shown by the grey histogram while the yellow hatched histogram shows only those associated with one or more ATLASGAL CSC sources. The red hatched histogram shows the flux distribution of the filaments that are associated with massive star forming clumps.
Current usage metrics show cumulative count of Article Views (full-text article views including HTML views, PDF and ePub downloads, according to the available data) and Abstracts Views on Vision4Press platform.
Data correspond to usage on the plateform after 2015. The current usage metrics is available 48-96 hours after online publication and is updated daily on week days.
Initial download of the metrics may take a while.