Fig. 1
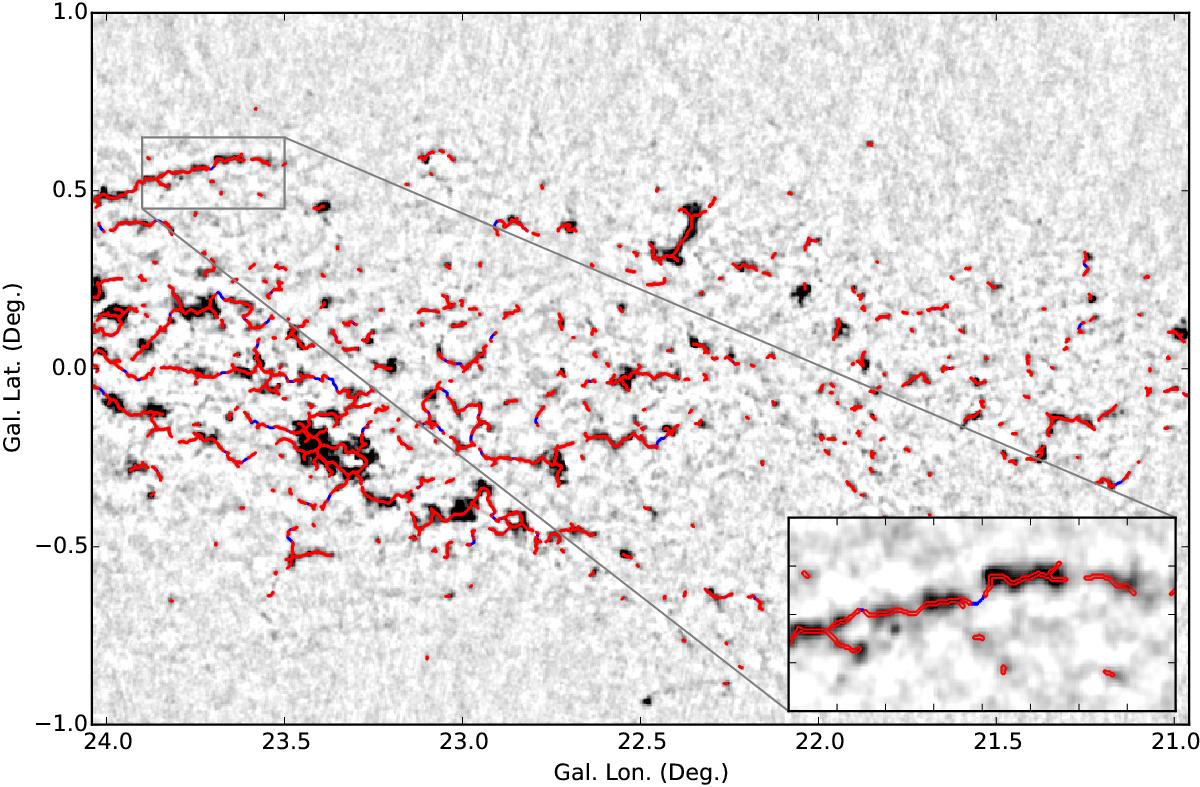
Emission map of the ℓ = 22° field that has been used to optimise the persistence and robustness thresholds used by DisPerSE. This map is overlaid with the skeletons obtained using a high robustness threshold that trace the high-column density regions shown in red (i.e. p = 1.4 and r = 2.5) and the inter-connecting skeletons obtained using a lower robust threshold that traces the lower column density connecting regions are shown in blue (i.e. p = 1.4 and r = 1.95).
Current usage metrics show cumulative count of Article Views (full-text article views including HTML views, PDF and ePub downloads, according to the available data) and Abstracts Views on Vision4Press platform.
Data correspond to usage on the plateform after 2015. The current usage metrics is available 48-96 hours after online publication and is updated daily on week days.
Initial download of the metrics may take a while.