Free Access
Fig. 8
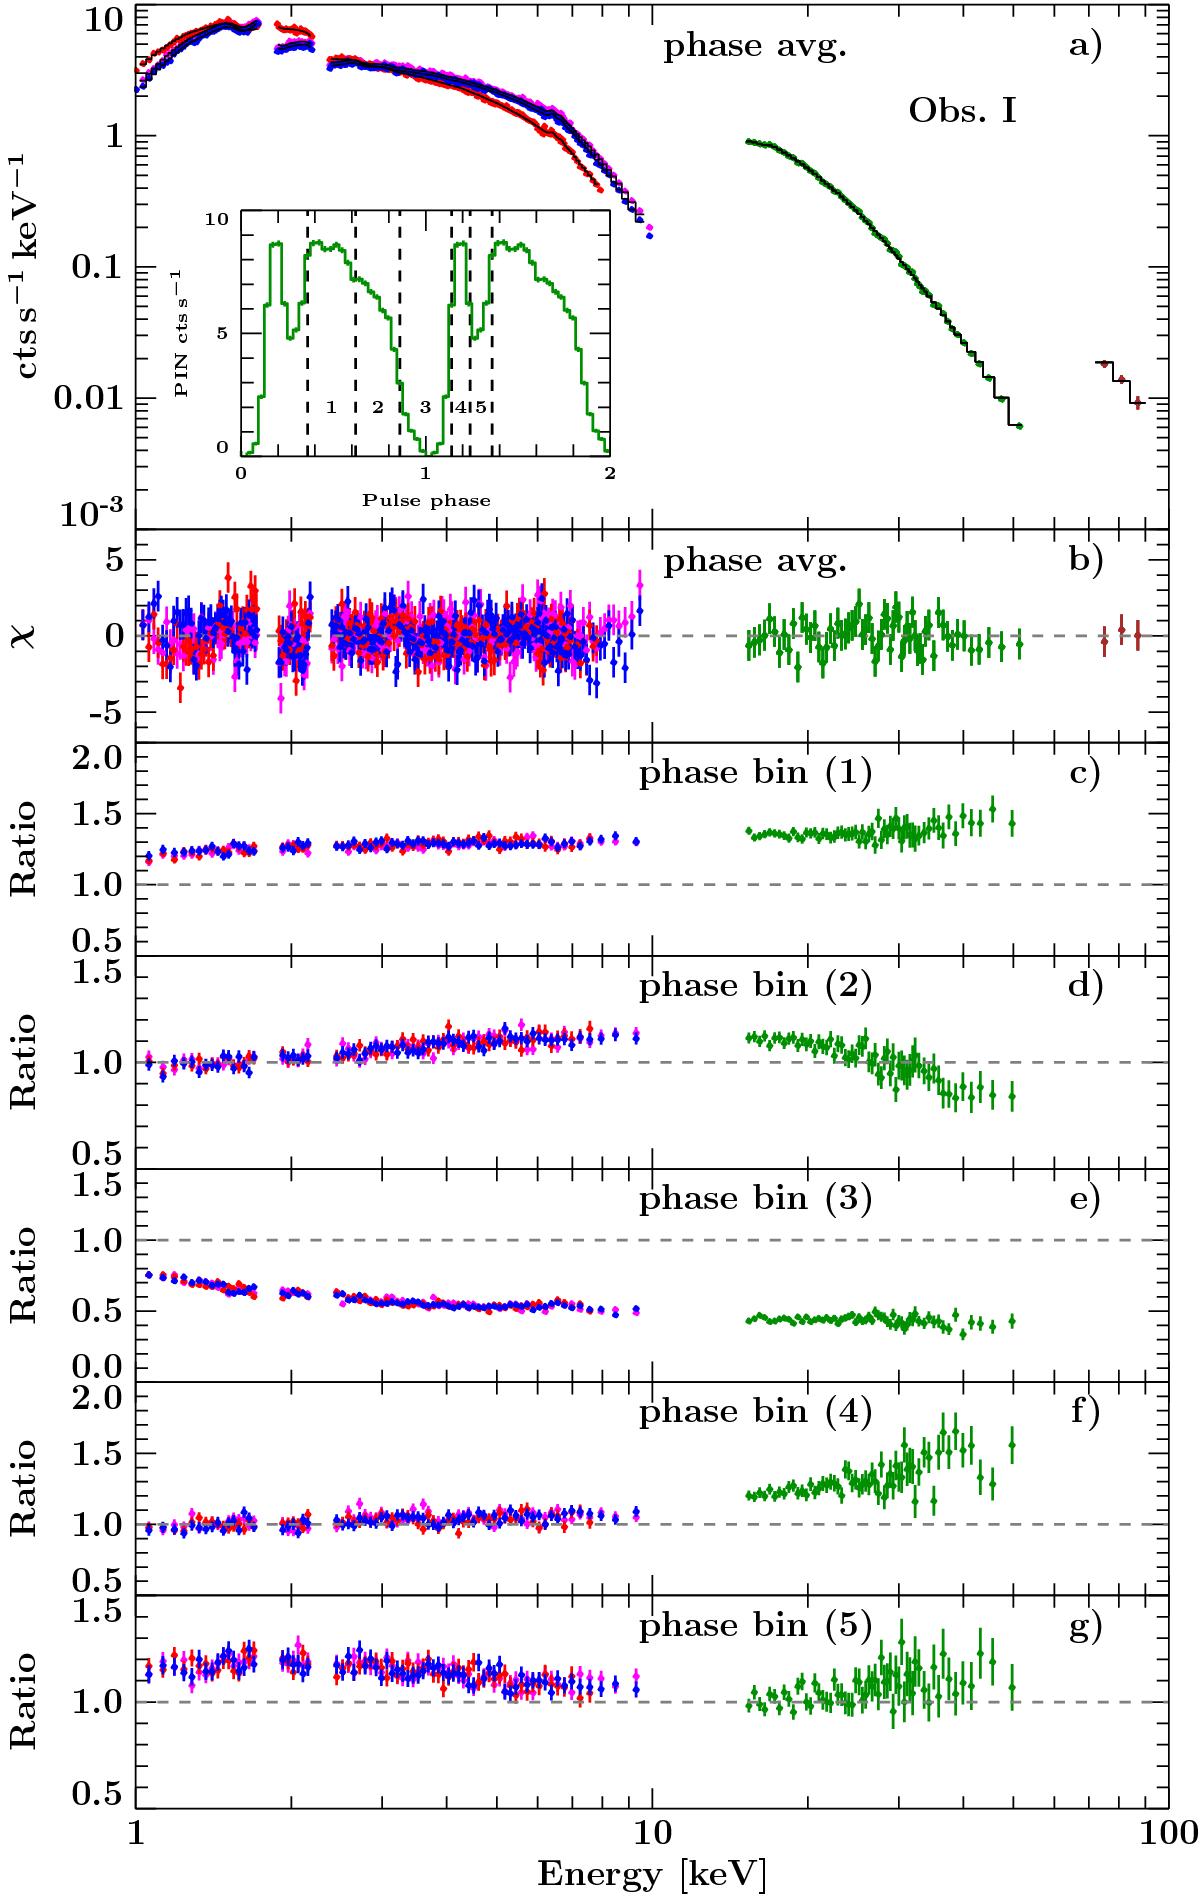
Panels a) and b): phase-averaged spectrum of XIS0 (blue), XIS1 (red), XIS3 (magenta), PIN (green), and GSO (brown) of Obs. I with best-fit model and residuals. Panels c) through g): count rates of the respective phase-resolved spectra (1) to (5), divided by the count rate of the phase-averaged spectrum.
Current usage metrics show cumulative count of Article Views (full-text article views including HTML views, PDF and ePub downloads, according to the available data) and Abstracts Views on Vision4Press platform.
Data correspond to usage on the plateform after 2015. The current usage metrics is available 48-96 hours after online publication and is updated daily on week days.
Initial download of the metrics may take a while.