Fig. 7
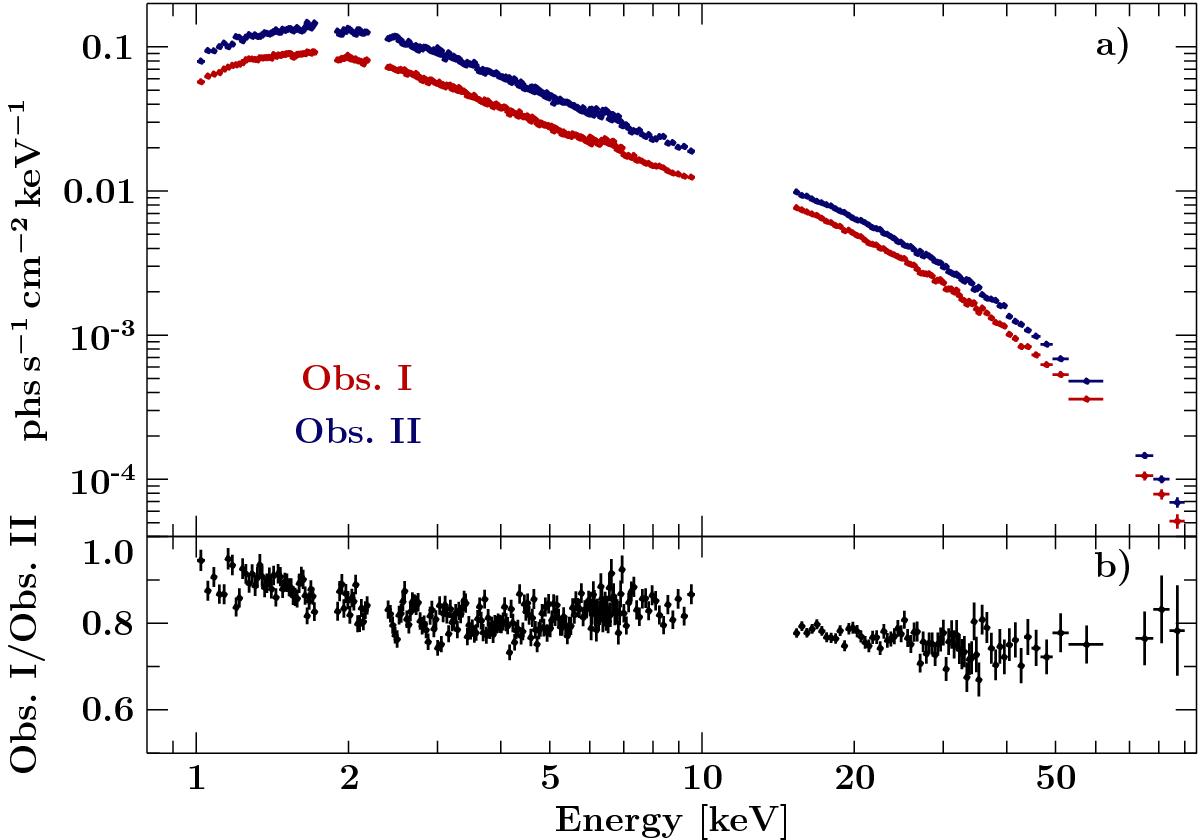
a) Unfolded phase-averaged spectra of Obs. I (red) and Obs. II (blue) and b) ratio of the phase-averaged spectra of Obs. I and Obs. II. For clarity, only XIS3, PIN and GSO data are shown in both panels. The ratios of the individual detectors have been corrected for the respective cross-calibration constants given in Table 2.
Current usage metrics show cumulative count of Article Views (full-text article views including HTML views, PDF and ePub downloads, according to the available data) and Abstracts Views on Vision4Press platform.
Data correspond to usage on the plateform after 2015. The current usage metrics is available 48-96 hours after online publication and is updated daily on week days.
Initial download of the metrics may take a while.