Free Access
Fig. 4
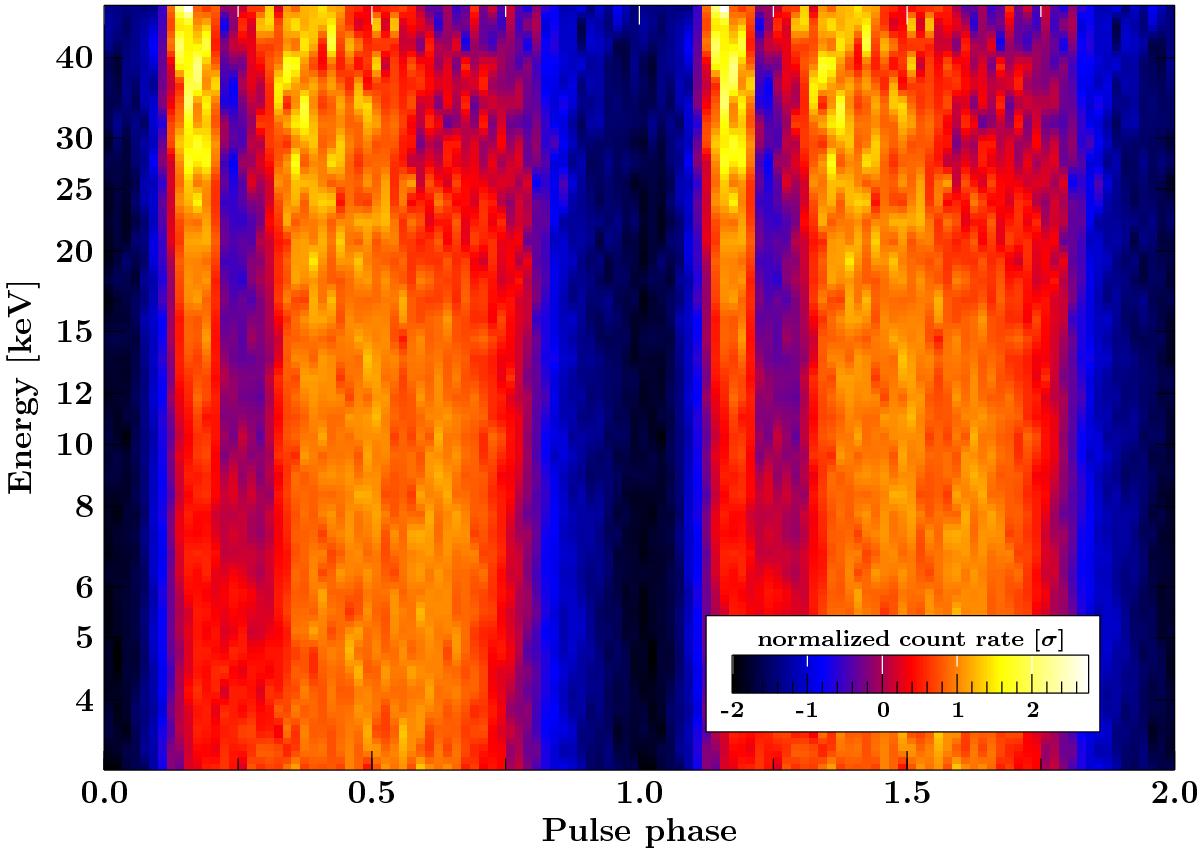
Color-coded map of the count rate distribution of the NuSTAR observation as a function of energy and pulse phase. Each row represents a normalized pulse profile at the respective energy and each column, technically, indicates a phase-resolved spectrum. All profiles are shown twice for clarity.
Current usage metrics show cumulative count of Article Views (full-text article views including HTML views, PDF and ePub downloads, according to the available data) and Abstracts Views on Vision4Press platform.
Data correspond to usage on the plateform after 2015. The current usage metrics is available 48-96 hours after online publication and is updated daily on week days.
Initial download of the metrics may take a while.