Fig. 3
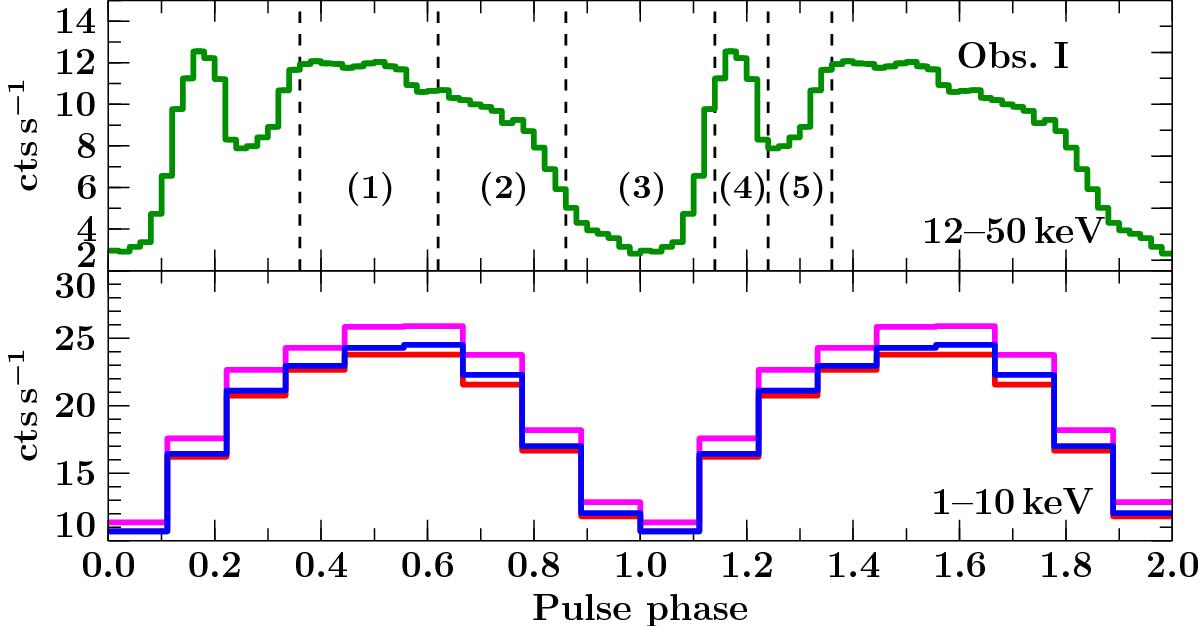
Background-subtracted pulse profiles of Obs. I. The upper panel shows the PIN profiles with the phase intervals chosen for phase-resolved spectral analysis. The lower panel shows the XIS0 (blue), XIS1 (red), XIS3 (magenta) profiles. The pulse profiles are very similar to those of Obs. II. All profiles are shown twice for clarity.
Current usage metrics show cumulative count of Article Views (full-text article views including HTML views, PDF and ePub downloads, according to the available data) and Abstracts Views on Vision4Press platform.
Data correspond to usage on the plateform after 2015. The current usage metrics is available 48-96 hours after online publication and is updated daily on week days.
Initial download of the metrics may take a while.