Free Access
Fig. 4
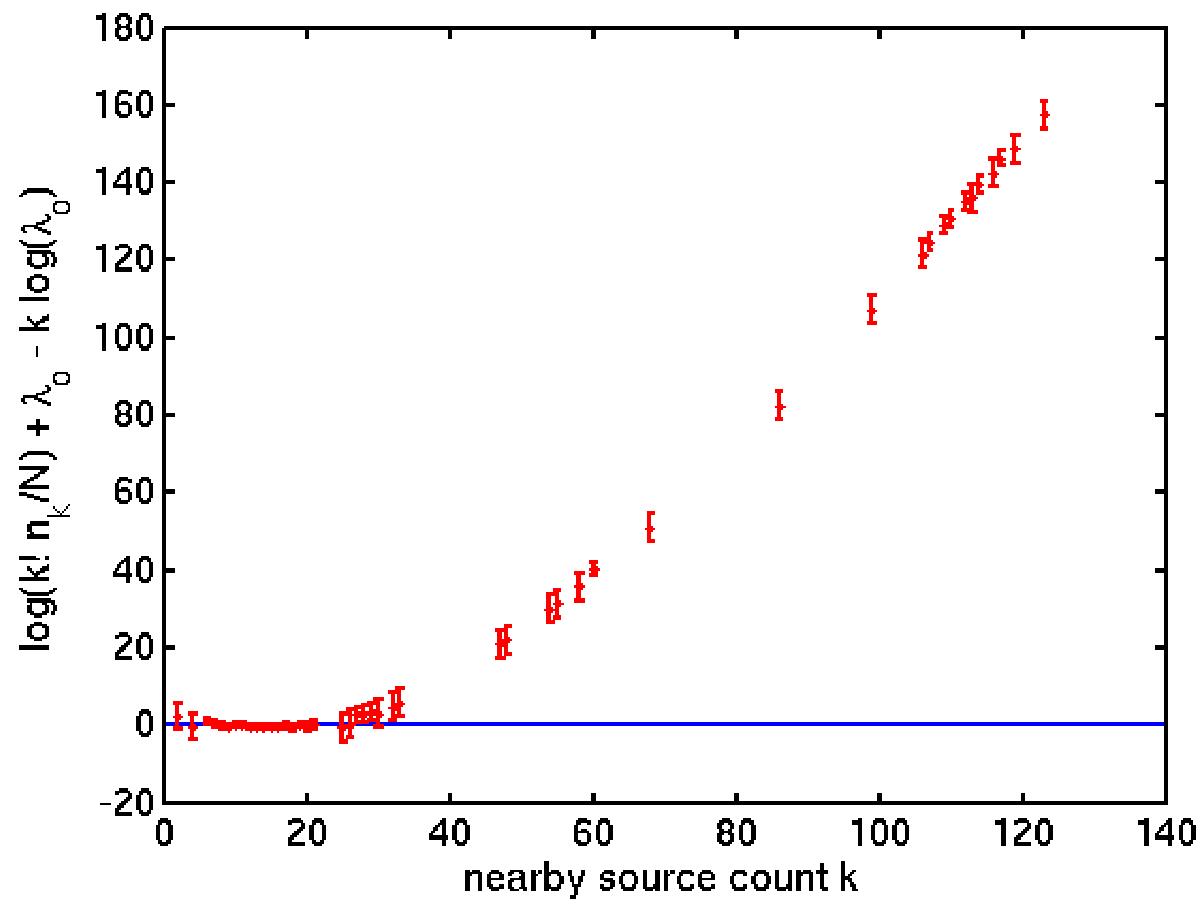
Poissonness plot of the nearby source counts. λo is the mean nearby count over the survey area. N is the total number of sources with S> 2.5 Jy. The solid horizontal line corresponds to a perfectly Possion distributed nearby source count. The error bars denote the 99% confidence levels.
Current usage metrics show cumulative count of Article Views (full-text article views including HTML views, PDF and ePub downloads, according to the available data) and Abstracts Views on Vision4Press platform.
Data correspond to usage on the plateform after 2015. The current usage metrics is available 48-96 hours after online publication and is updated daily on week days.
Initial download of the metrics may take a while.