Fig. 3
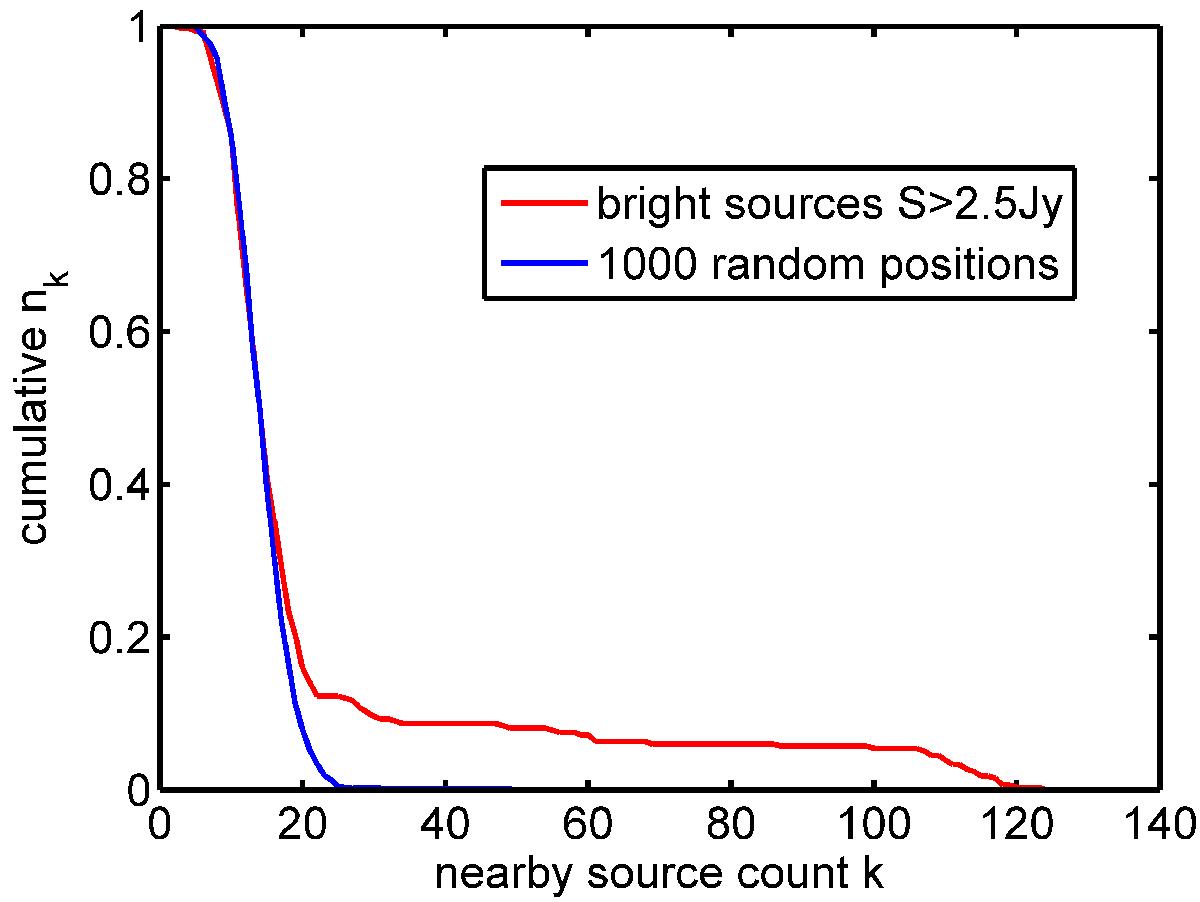
Cumulative distribution of nearby source counts (disks with radius 0.6°). The red line corresponds to nearby source counts around bright radio galaxies with S> 2.5 Jy. The blue line corresponds to 1000 randomly picked positions outside the galactic plane (| b | > 5°). The maximum of randomly picked counts results in 49 nearby sources.
Current usage metrics show cumulative count of Article Views (full-text article views including HTML views, PDF and ePub downloads, according to the available data) and Abstracts Views on Vision4Press platform.
Data correspond to usage on the plateform after 2015. The current usage metrics is available 48-96 hours after online publication and is updated daily on week days.
Initial download of the metrics may take a while.