Free Access
Fig. 2
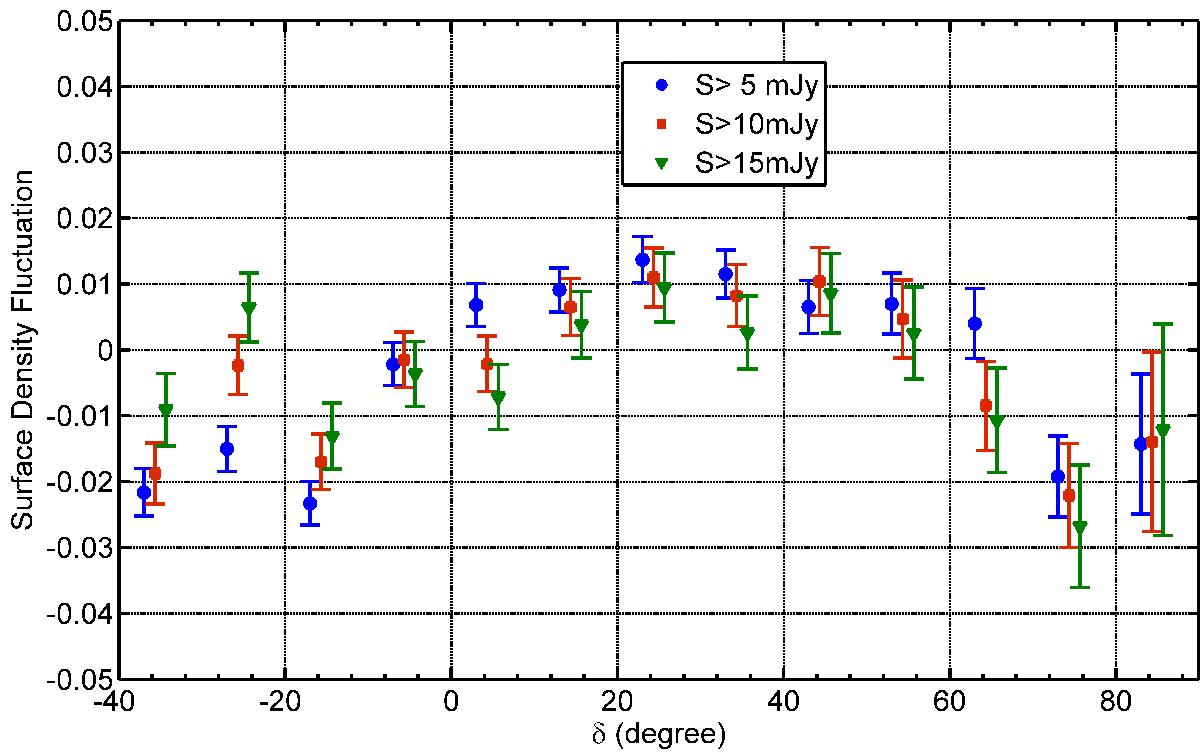
Surface density fluctuation, ![]() , of the NVSS catalogue as a function of declination for several flux density thresholds. The error bars assume Poisson distributed source counts and we mask the region | b | ≤ 5°. For clarity, the horizontal positions of the S> 5 mJy and S> 15 mJy data points are slightly offset.
, of the NVSS catalogue as a function of declination for several flux density thresholds. The error bars assume Poisson distributed source counts and we mask the region | b | ≤ 5°. For clarity, the horizontal positions of the S> 5 mJy and S> 15 mJy data points are slightly offset.
Current usage metrics show cumulative count of Article Views (full-text article views including HTML views, PDF and ePub downloads, according to the available data) and Abstracts Views on Vision4Press platform.
Data correspond to usage on the plateform after 2015. The current usage metrics is available 48-96 hours after online publication and is updated daily on week days.
Initial download of the metrics may take a while.