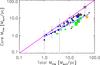
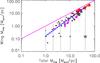
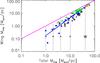
Fig. 8
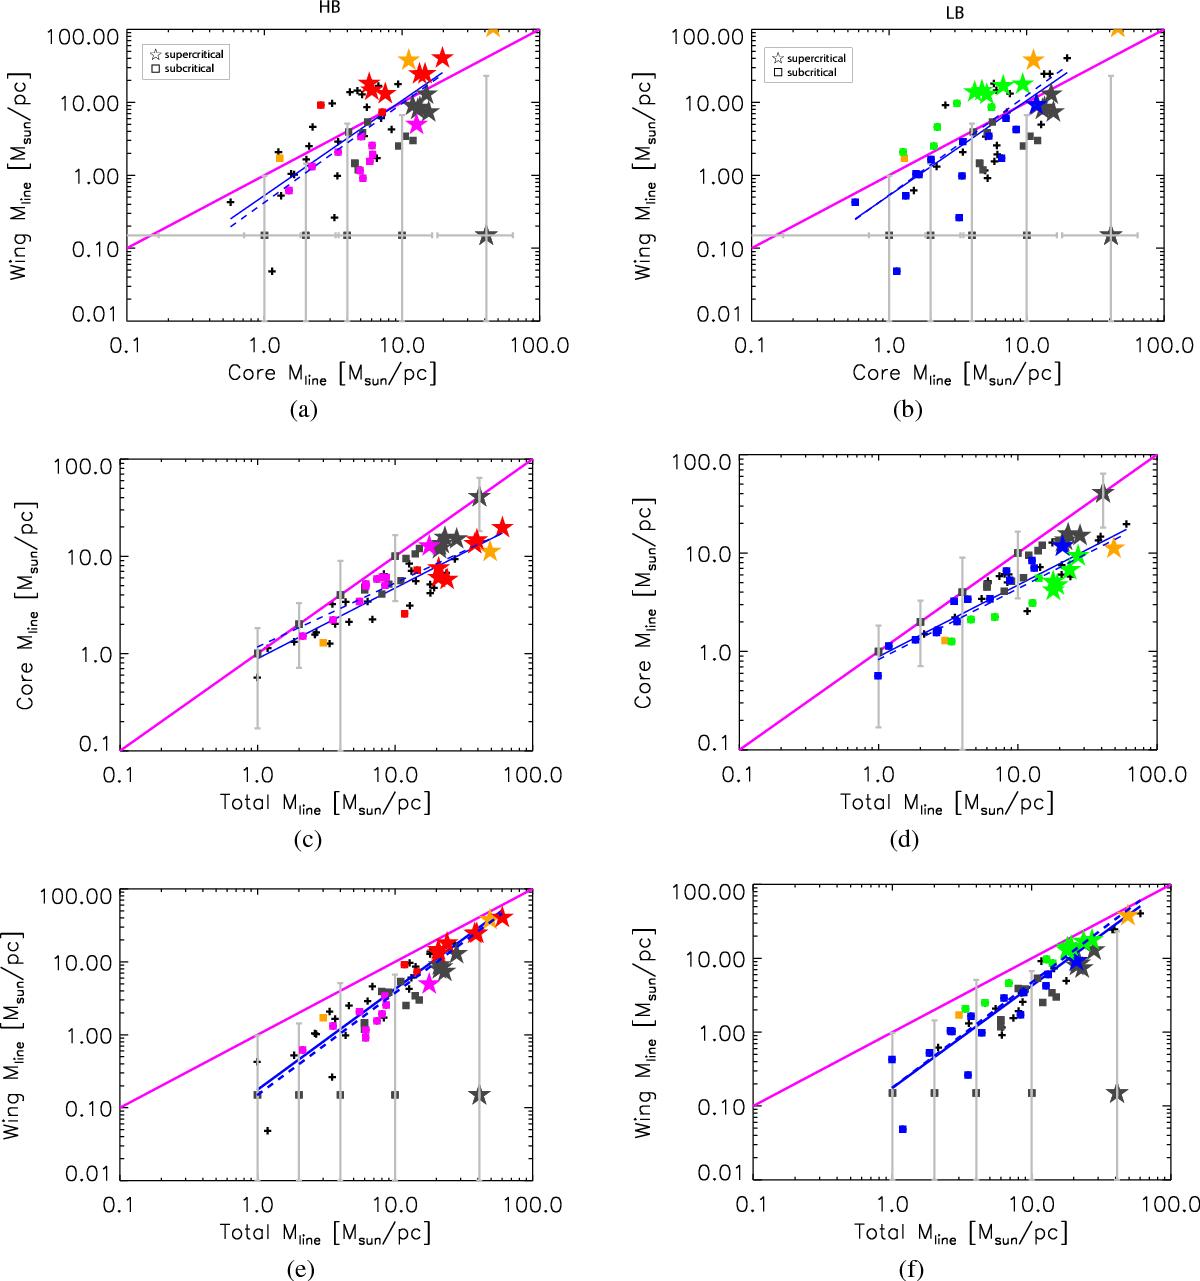
Correlation of Mline,core, Mline,wing, and Mline,tot for core-scale filaments in high backgrounds (filled red and magenta symbols in panels a, c, and e) and low backgrounds (filled blue and green symbols in panels b, d, and f). Best linear fits according to environment and for the entire population (background-independent) are shown as (blue) dashed and solid lines, respectively. Plots include the parameters derived for filaments from Arzoumanian et al. (2011): core-dominated (dark grey) and wing-dominated (orange) symbols. Error bars are shown only for filaments consistent with having no wing contribution (assigned a default value of Mline,wing= 0.1 M⊙ pc-1 for plotting purposes). Here, uncertainties for the core and wing contributions are those estimated for the core component based on their quoted uncertainties on width and column density. As reference, black crosses in panels a, c, and e mark the position of filaments in low-backgrounds. Crosses in panels b, d, and f mark those in high-backgrounds. Other symbols, lines, and colours are as in Fig. 5.
Current usage metrics show cumulative count of Article Views (full-text article views including HTML views, PDF and ePub downloads, according to the available data) and Abstracts Views on Vision4Press platform.
Data correspond to usage on the plateform after 2015. The current usage metrics is available 48-96 hours after online publication and is updated daily on week days.
Initial download of the metrics may take a while.