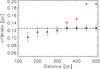
Fig. 6
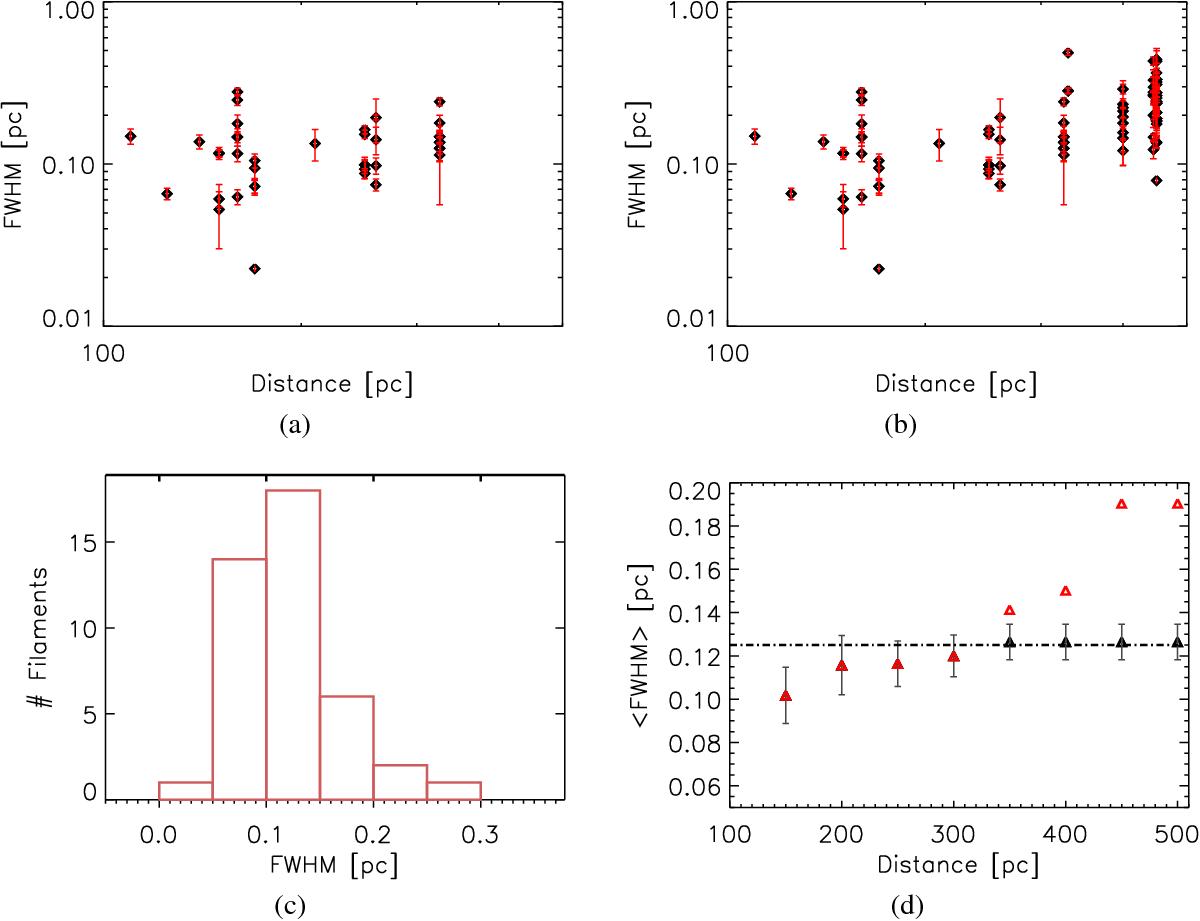
Filament width (Gaussian FWHM) properties for the final SI-sample: a) filament width as a function of field distance; b) same as Fig. 6a, but without the 3σ distance uncertainty constraint (see text); c) width distribution histogram; d) variation of the (accumulated) average FWHM of filaments with distance for the final sample (triangles with error bars) relative to that of the filament sample in Fig. 6b (red triangles). Dash-dotted line in Fig. 6d indicates the median FWHM of the SI sample.
Current usage metrics show cumulative count of Article Views (full-text article views including HTML views, PDF and ePub downloads, according to the available data) and Abstracts Views on Vision4Press platform.
Data correspond to usage on the plateform after 2015. The current usage metrics is available 48-96 hours after online publication and is updated daily on week days.
Initial download of the metrics may take a while.