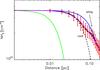
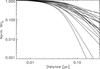
Fig. 3
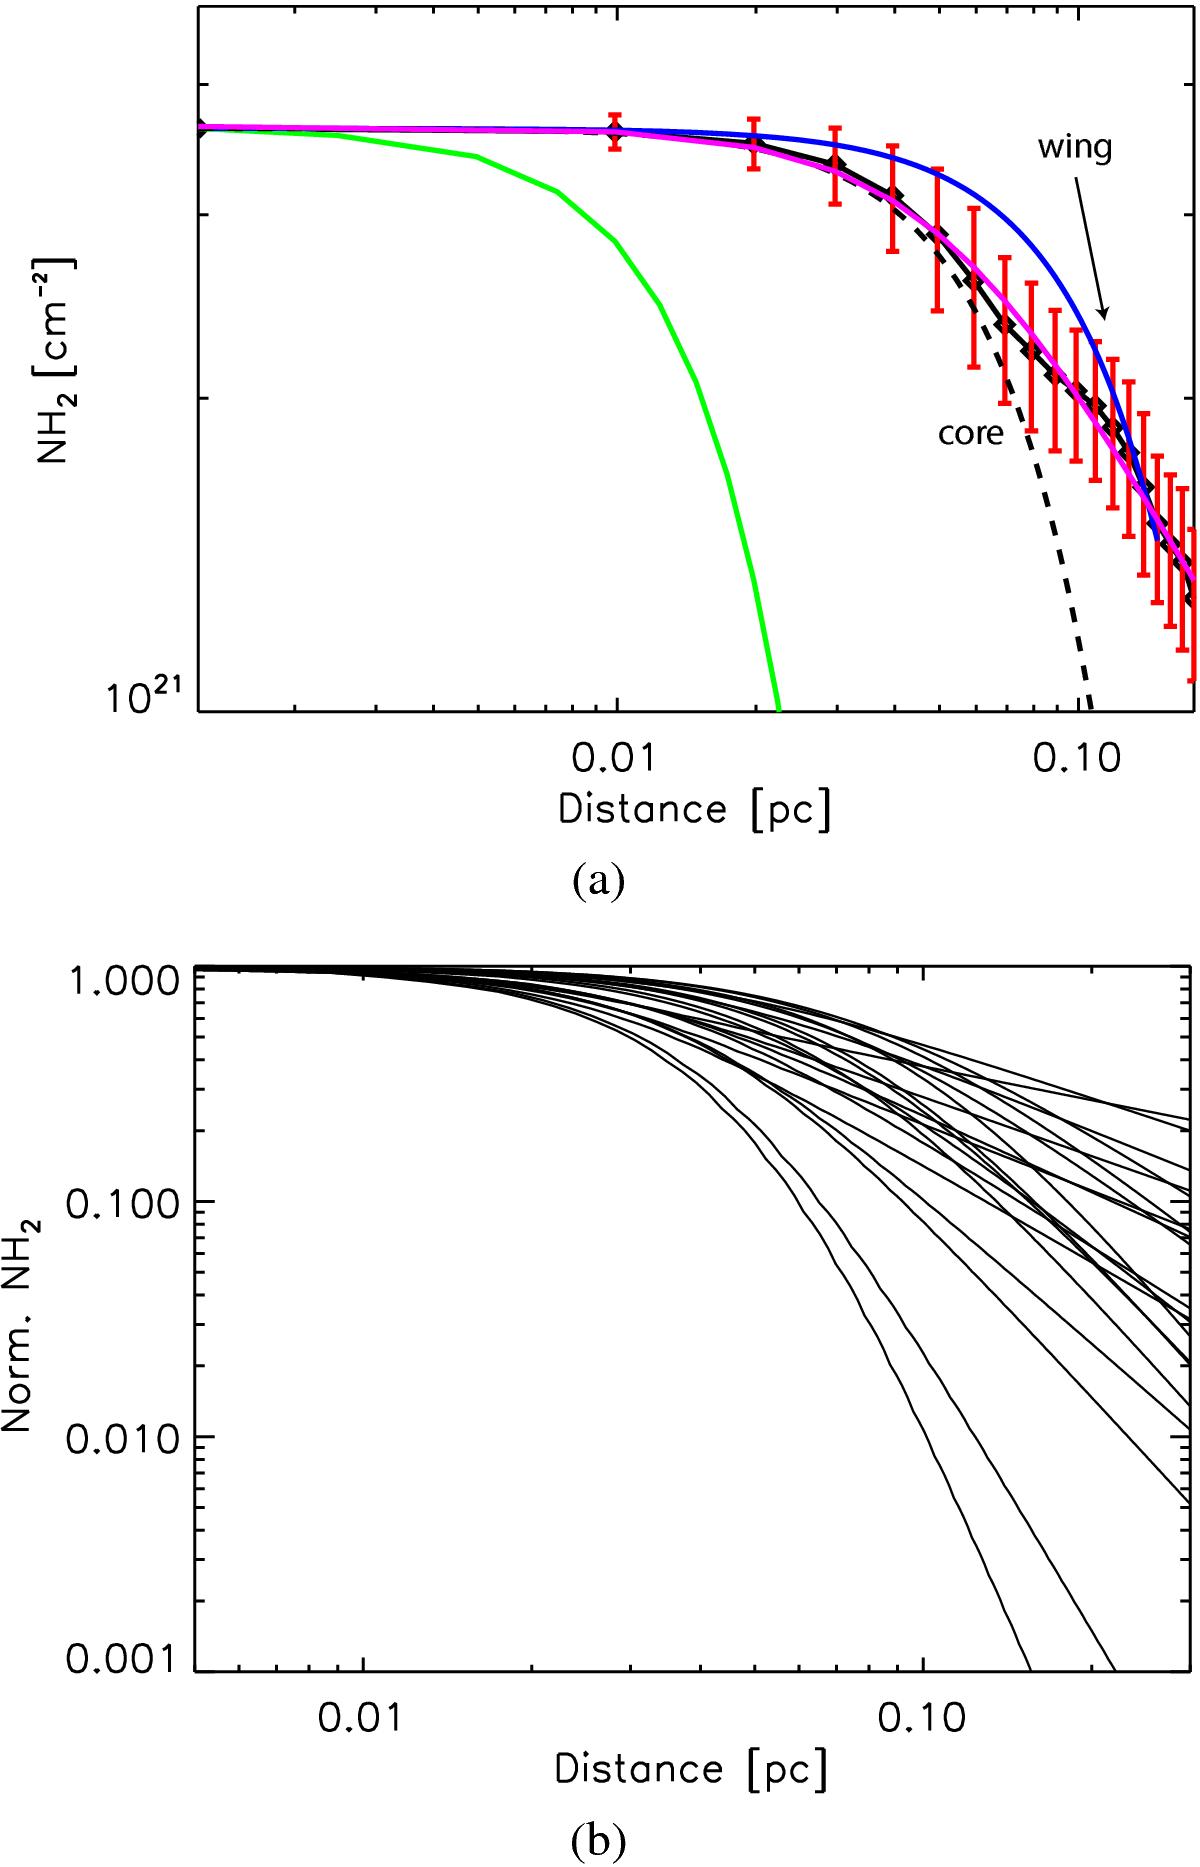
a) Skeleton-averaged filament column density profile (black curve) with best-fit (magenta) Plummer-like function. The best-fit (blue) Gaussian function to the data (no fitting radius restriction) is shown relative to the final best Gaussian function representing the innermost regions of the profile (black dashed-curve) and the 40′′ telescope beam (green). Error bars show the dispersion of column density along the filament. The Gaussian-like inner regions of the profile (core component) can be separated from the wing component of the filament, associated with the (outer) power-law regions of the Plummer profile not accounted for by the Gaussian function. b) Sample of 20 best-fit Plummer-like models (normalised: NH2= 1 at radial distance from filament centre R ≈ 0) with varying proportions of core and wing components.
Current usage metrics show cumulative count of Article Views (full-text article views including HTML views, PDF and ePub downloads, according to the available data) and Abstracts Views on Vision4Press platform.
Data correspond to usage on the plateform after 2015. The current usage metrics is available 48-96 hours after online publication and is updated daily on week days.
Initial download of the metrics may take a while.