Fig. 1
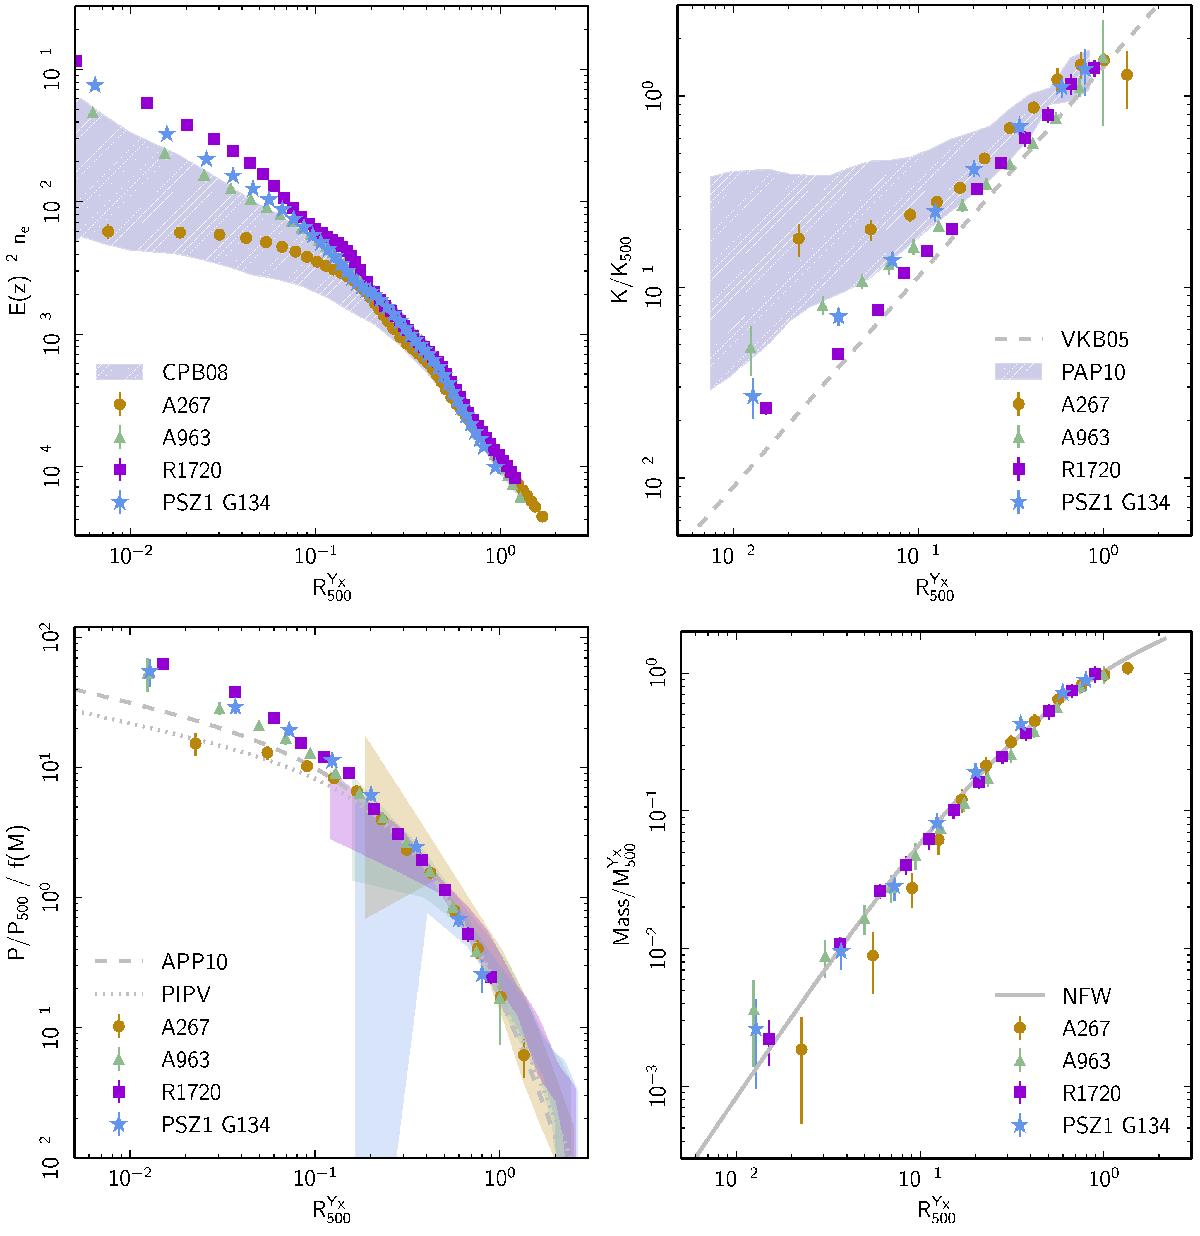
Top left: scaled density profiles compared to the 1σ dispersion of the rexcess sample (Croston et al. 2008). Top right: scaled entropy profiles compared to the 1σ dispersion of the rexcess sample (Pratt et al. 2010); the dashed line is the baseline gravitational entropy profile of Voit et al. (2005). Bottom left: scaled pressure profiles (points: X-ray, envelopes: SZ) compared to the universal pressure profile of Arnaud et al. (2010) and the mean stacked profile of Planck Collaboration Int. V (2013). f(M) is a (small) correction for the mass dependence in the pressure profile shape (see Arnaud et al. 2010). Bottom right: scaled hydrostatic mass profiles compared to an NFW profile with c = 3.5, for illustration only. Density, entropy, pressure, and mass profiles are renormalised by E(z)-2, K500, P500, and ![]() , respectively.
, respectively.
Current usage metrics show cumulative count of Article Views (full-text article views including HTML views, PDF and ePub downloads, according to the available data) and Abstracts Views on Vision4Press platform.
Data correspond to usage on the plateform after 2015. The current usage metrics is available 48-96 hours after online publication and is updated daily on week days.
Initial download of the metrics may take a while.