| Issue |
A&A
Volume 590, June 2016
|
|
|---|---|---|
| Article Number | A39 | |
| Number of page(s) | 9 | |
| Section | Stellar atmospheres | |
| DOI | https://doi.org/10.1051/0004-6361/201628279 | |
| Published online | 04 May 2016 | |
Chemical abundances in a high-velocity RR Lyrae star near the bulge⋆
1 Dark Cosmology Centre, The Niels Bohr Institute, Juliane Maries Vej 30, 2100 Copenhagen, Denmark
e-mail: This email address is being protected from spambots. You need JavaScript enabled to view it.
2 University of California Los Angeles, Department of Physics & Astronomy, Los Angeles, CA, USA
3 Zentrum für Astronomie der Universität Heidelberg, Landessternwarte, Königstuhl 12, 69117 Heidelberg, Germany
4 Phyics Department, Lancaster University, Lancaster LA1 4YB, UK
5 European Southern Observatory, Karl-Schwarzschild-Straße 2, 85748 Garching, Germany
6 Leibniz-Institut für Astrophysik Potsdam, An der Sternwarte 16, 14482 Potsdam, Germany
Received: 9 February 2016
Accepted: 16 March 2016
Abstract
Low-mass variable high-velocity stars are interesting study cases for many aspects of Galactic structure and evolution. Until recently, the only known high- or hyper-velocity stars were young stars thought to originate from the Galactic center. Wide-area surveys such as APOGEE and BRAVA have found several low-mass stars in the bulge with Galactic rest-frame velocities higher than 350 km s-1. In this study we present the first abundance analysis of a low-mass RR Lyrae star that is located close to the Galactic bulge, with a space motion of ~–400 km s-1. Using medium-resolution spectra, we derived abundances (including upper limits) of 11 elements. These allowed us to chemically tag the star and discuss its origin, although our derived abundances and metallicity, at [Fe/H] =−0.9 dex, do not point toward one unambiguous answer. Based on the chemical tagging, we cannot exclude that it originated in the bulge. However, its retrograde orbit and the derived abundances combined suggest that the star was accelerated from the outskirts of the inner (or even outer) halo during many-body interactions. Other possible origins include the bulge itself, or the star might have been stripped from a stellar cluster or the Sagittarius dwarf galaxy when it merged with the Milky Way.
Key words: stars: abundances / stars: variables: RR Lyrae / stars: Population II / stars: kinematics and dynamics / Galaxy: bulge / Galaxy: halo
The data presented herein were obtained at the W. M. Keck Observatory, which is operated as a scientific partnership among the California Institute of Technology, the University of California and the National Aeronautics and Space Administration. The Observatory was made possible by the generous financial support of the W. M. Keck Foundation.
© ESO, 2016
1. Introduction
RR Lyrae stars are short-period variables that are luminous old Population II stars, which makes them ideal for numerous astronomical studies. Owing to their pulsations (with periods of 0.2−1 days), we can determine their distances through the period-luminosity relation, while their high luminosity allows us to detect them at greater distances in remote systems than is possible with fainter less evolved dwarf and giant stars.
RR Lyrae stars have very compact centers containing most of their mass, while very little mass is found in the outer 50% (in radius) of the star (Smith 1995). The RR Lyrae lie in the instability strip on the horizontal branch and thus have temperatures between 6100−7400 K. Most RR Lyrae stars are on the zero-age horizontal branch (ZAHB), which means that they are burning He to C in the core. In addition to the core-burning, H is fused to He in a shell. The exact chemical composition, especially the He content, will dictate the evolution and pulsation properties of these variable stars (Smith 1995). Depending on how the RR Lyrae pulsate (fundamental note versus first overtone), they are grouped into three subclasses (Bailey types). The first two are RRab vs RRc, where the former shows asymmetric light curves with larger variations in magnitude than the latter c type, which show smoother low-amplitude variations. According to Smith (1995) and Preston (2011), the typical pulsational velocity of RRab are 60−70 km s-1 (however, larger amplitudes can be reached depending on the star’s V magnitude; Liu 1991), while those of RRc only vary with 30−40 km s-1. Finally, the multi-mode RRd variables pulsate in both the fundamental and the first overtone and compose the smallest subgroup among these three types (Brown et al. 2004). Previous studies (e.g., Clementini et al. 1995; For et al. 2011; Hansen et al. 2011; Haschke et al. 2012) have shown that despite the evolved stage of RR Lyrae stars, they seem to preserve the original surface composition they were born with for most of the heavy elements (except for lithium). This makes them excellent study cases for chemical tagging in the Milky Way and in Local Group galaxies (e.g., Brown et al. 2004; Da Costa et al. 2010).
Date of observation, coordinates, heliocentric Julian date (HJD), integration times, and phase for m176.
The age and low metallicity of the RR Lyrae stars make them useful probes of the original chemical composition of the old components of the Milky Way, namely the halo and bulge. Layden et al. (1996) showed in a kinematic study that some of the more metal-rich ([Fe/H] = −1.0) RR Lyrae stars belong to the thick disk. This was confirmed by the more recent Northern Sky Variability Survey (Kinemuchi et al. 2006) despite their uncertainties in visual amplitudes and thus V magnitudes. An indication of the Galactic component in which the RR Lyrae could reside is given by the stellar metallicity. A [Fe/H] > −1.0 might indicate that the star belongs to the thick disk or bulge, while a lower value −1.0 to −2.5 would point toward it being a (inner or outer) halo star. Towards the central regions of the Milky Way, metallicity alone becomes an insufficient parameter, and large surveys have found an overlap of the bulge component with the metal-weak thick disk and the inner halo (i.e., within 3.5 kpc, e.g., Fulbright et al. 2007; Kunder et al. 2012; Ness et al. 2013; Johnson et al. 2014). This distinction is significant because the inside-out formation of the Galaxy dictates that the oldest and most (extremely) metal-poor stars should be found in the very center (Tumlinson 2010), rendering them inner halo stars (by formation and chemistry) that happen to be located within the bulge. While still low in numbers, the very metal-poor bulge stars known to date show chemical abundances that vastly overlap with those of the metal-poor halo distribution (e.g., Casey & Schlaufman 2015; Koch et al. 2016; Howes et al. 2015). Their kinematics then indicates that their orbits are mainly confined to the inner few kpc of the Galaxy (although the star we consider here is not confined to the innermost parts).
For this reason, the high-velocity star (HVS) investigated in Kunder et al. (2015) is of particular interest because it was found to be a metal-poor RR Lyrae (type ab) star moving with a high Galactic rest-frame velocity of −482 km s-1 on an eccentric orbit around the bulge and into the halo. Previously, most of the high-to-hyper-velocity stars were thought to be young (relatively massive) hot stars originating from the Galactic center (e.g., Hills 1988; Brown 2015, and references therein). However, the recent SEGUE study by Palladino et al. (2014) used a combination of radial velocities and proper motions to show that low-mass F and G stars could be traveling with high enough speed to allow them to escape the Galaxy, and that these stars did not originate in the Galactic center (see also Kollmeier et al. 2010; Nidever et al. 2012). Geier et al. (2015) confirmed these findings by conducting a kinematic and spectroscopic follow-up of the fastest known HVS star, which travels at ~1200 km s-1 through the Galaxy. Moreover, this star (US 708, a hot subdwarf), was found to be a low-mass compact He star that in addition to its fast space motion is also a fast rotator (Geier et al. 2015, and references therein). The recent study by Li et al. (2015) found 19 HVS candidate stars in the first LAMOST data release, and they suggested that these stars might originate from the Galactic bulge. Kunder et al. (2016) also found a subgroup of high-velocity RR lyrae stars in the bulge.
This makes the very evolved RR Lyrae star of Kunder et al. (2015) an interesting study case because it is to our knowledge the first high-velocity evolved RR Lyrae star to travel at high speed between different Galactic components (disk, bulge, and halo). Despite its current position close to the bulge, it is believed that the RR Lyrae star (MACHO 176.18833.411) originates in the halo, a conclusion reached by tracing back the calculated orbits. Here we conduct a detailed medium-resolution follow-up study of this star to trace and understand the origin of this high-velocity RR Lyrae star.
2. Observations and data reduction
MACHO 176.18833.411 (hereafter m176) was observed three times on 24 April 2015 using the Echellette Spectrograph and Imager (ESI; Sheinis et al. 2002) at Keck II with a slit of 0.5′′, resulting in a resolution of R ~ 8000. Each exposure lasted 1800 s and was obtained at phase 0.55−0.63, which coincides with the minimum light phase (for further details see Table 1). This star has a stable period of 0.5152d according to Soszyński et al. (2014) and Kunder et al. (2015). With an integration time of 1800 s, the observations lasted for about 4% of the pulsation period. This is approximately a factor of three longer than the integration times used in For et al. (2011), but our integration times are still short enough to avoid smearing of the spectra and the lines maintain a clean Gaussian profile (see Fig. 1). This star is fairly faint (⟨V⟩ = 17.586), which makes it hard to obtain a high-resolution spectrum with a high signal-to-noise ratio (S/N). The OGLE V and I light curves as reported in Kunder et al. (2015) clearly show the characteristic asymmetric variations of an RR Lyrae ab type variable.
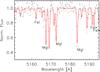 |
Fig. 1 Spectral region of m176 around the Mg triplet. Overall the fit is acceptable, but we are biased toward measuring strong lines that do not always yield the same abundance as weaker lines. A few of the weaker but blended Fe lines are shown here and marked with an asterisk (the two reddest lines). |
The data were reduced using the Makee pipeline1, which conducts standard data reduction operations such as bias subtraction, flat-fielding, and wave calibration, including several wavelength corrections, such as applying air-to-vacuum and heliocentric velocity corrections. Since the spectra were obtained almost at the same phase, the extracted 1D spectra could be co-added to a single spectrum to increase the S/N. The spectrum was then shifted to rest wavelength and the continuum was normalized in IRAF by dividing the spectrum by a fitted pseudo continuum. The final spectrum spans a wavelength range from ~3800−11 000 Å. A S/N of ~40 per pixel (or ~130 per Å) was estimated from a spectral region around 7000 Å.
3. Stellar parameters and abundances
The stellar parameters were derived using only the spectra. As a first pass, we measured equivalent widths (EWs) for 17 Fe I and 4 Fe II lines. These lines allowed for a first rough determination of the stellar parameters. At this resolution, most Fe lines are blended or too noisy to be useful for determining the parameters (see Fig. 1), and we ended up with 13 Fe I and 2 Fe II lines (see Table A.1). The remaining 15 useful Fe lines were used to determine an excitation temperature by requiring that all Fe I lines yield the same Fe abundance regardless of excitation potential. The microturbulence velocity was set by requiring that all Fe lines produce the same Fe abundance, and the gravity was fixed by changing this model parameter until the same abundance values for Fe I and Fe II were obtained. Since we only have two Fe II lines, this parameter is more uncertain than the other parameters, which rely on Fe I measurements. The value obtained for log g is reasonable for RR Lyrae stars, however. The metallicity was updated by synthesizing weaker Fe lines, which yielded a somewhat lower [Fe/H] value than derived from the strong EW measurements. The final set of stellar parameters is (T [K]/log g/[Fe/H]/ξmic [km s-1]): 6600 ± 100 / 2.0 ± 0.3 / −0.9 ± 0.2 / 4.5 ± 0.2.
To obtain an improved estimate of the gravity, we used the Yale isochrones (Demarque et al. 2004) and an IDL program by Yong et al. (2013). However, the program failed to return a value for this very evolved RR Lyrae star. The [Fe/H] from weak line synthesis was confirmed by measuring the bluest Ca line (8498 Å) in the near-infrared Ca II triplet and inserting the EW into the [Fe/H]-EW(Ca) relation of Gomez et al. (2011) and Wallerstein et al. (2012). Several independent EW measurements yielded a metallicity of [Fe/H] =−0.85 ± 0.15, which agrees very well with the weak line value of [Fe/H] =−0.9. The uncertainty in the Ca EW originates from continuum placement and to a lesser extent from the profile fitted (Gauss versus Voigt − we note that a Lorentzian should not be used because it overestimates the EW and in turn the [Fe/H] value).
The stellar abundances were derived using an interpolated new-ODF (new opacity distribution function) ATLAS9 model atmosphere (Castelli & Kurucz 2003; Allende Prieto et al. 2004) in conjunction with the MOOG spectrum synthesis code (Sneden 1973, version 2014). We decided to only rely on spectral lines in the region 5000−9000 Å to obtain the cleanest lines (with fewest blends and lower noise) to derive the best possible abundances. This, on the other hand, also means that we used medium to strong lines for this analysis, since the spectrum quality prevented us from using weak lines. By conducting spectrum synthesis, we determined abundances (including upper limits) for eleven elements that are listed in Table 2 (see also Fig. 2). The lines to synthesize were selected from the line list in Hansen et al. (2011) to find the lines that are most likely detectable in RR Lyrae stars. The synthesis was conducted using a line list containing atomic data from Sneden et al. (2014), Hansen et al. (2013), Bergemann et al. (2012), Gallagher et al. (2012), Ivans et al. (2006), and Lawler et al. (2001).
Element, stellar abundances and line-to-line dispersion, and number of lines.
From Table 2 and Fig. 2 the derived abundances and upper limits for m176 are seen to agree well with the values derived for other RR Lyrae stars. When m176 is compared to the bulge study by Johnson et al. (2013), the abundances might generally agree with those derived for bulge stars, but the level of α-enrichment also agrees well with values published for the halo (Cayrel et al. 2004; Nissen & Schuster 2010). The Cr and Si abundances of m176 are slightly lower than is reported for the bulge stars (Johnson et al. 2013). For the Cr abundance we derived values for three lines, but one of them was more noisy and yielded a different value, which is why we only assigned this line half weight when calculating the final Cr abundance (hence the 2.5 lines listed in Table 2). The only real outlier is the oxygen abundance of m176. We used the O-triplet lines at 7774−7777 Å, which are affected by non-local thermodynamic equilibrium (NLTE) and 3D effects (Caffau et al. 2008; Nissen et al. 2014; Steffen et al. 2015; Amarsi et al. 2016). Both corrections need to be computed exactly for this star. However, for the Sun the corrected Otrip abundances would increase by ~0.15 dex (Steffen et al. 2015), which means that if we corrected our O abundance, it would most likely still be lower than the abundances derived for the other α-elements.
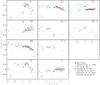 |
Fig. 2 Abundances of m176 compared to other RR Lyrae stars observed in a similar phase (around minimum light) and bulge stars. The RR lyrae star studies shown are Clementini et al. (1995), For et al. (2011), Hansen et al. (2011), Kolenberg et al. (2010), Haschke et al. (2012), and Johnson et al. (2013) as bulge comparison sample. |
The abundances seem to indicate that this RR Lyrae star is a rather normal halo star at [Fe/H] =−0.9, placing it in the more metal-rich tail of the halo metallicity distribution (Schörck et al. 2009). However, the metallicity also matches the moderately metal-poor stars in the bulge, where Li et al. (2015) recently found 19 candidate HVSs could originate from; for more details see Sects. 4 and 4.2. The analyzed lines and their atomic data are presented in Table A.1.
Uncertainties
The abundance uncertainties arise from stellar parameters, continuum placement, and the quality of the spectral fit, which, owing to the S/N and the medium resolution, is of slightly lower precision than high-resolution spectra with a higher S/N. This results in a line-to-line abundance variation of up to 0.2 dex, as seen for Fe and <0.11 dex for Mg when using lines weaker than the Mg triplet lines (Fig. 1 shows that the strong Mg-triplet lines are difficult to fit with one single abundance). The stellar parameter uncertainties of ± 100 K/± 0.3/± 0.2/± 0.2 km s-1 result in an abundance uncertainty of ~0.13−0.2 dex depending on the element. The uncertainty related to the continuum placement is typically 0.05 and for the spectrum fit it varies from higher S/N to lower S/N regions from 0.02−0.1 dex. By adding all the uncertainties in quadrature, we obtain a total uncertainty of 0.16−0.22 dex. For simplicity we adopt an average value of 0.2 dex for all elements in the figures.
Helium
The He I line at 5875.6 Å is an interesting absorption feature because it might tell us about the helium abundance in the star. The amount of helium is a governing factor in the pulsation and evolution of very evolved stars (such as RR Lyrae stars). The layer in which helium is being doubly ionized is responsible for absorbing heat during the stellar compression, and, in turn, for driving and maintaining the pulsations in the so-called γ-mechanism. However, the helium line is only visible in the maximum light phase (0.9−1.0), and since we have observed this RR Lyrae at minimum light, this line is unfortunately not detectable. Moreover, He I and II emission lines are also visible in the rising light phases or close to the peak, and the line strengths depend on the pulsation period, velocity amplitude, and metal abundance (for more details on He line behavior see Preston 2011).
3.1. Effect of microturbulence
Compared to other less evolved stars, the RR Lyrae stars have high microturbulences, ξmic. Moreover, the medium resolution and a S/N ~ 40 prevent us from using weak lines, therefore we suspect a few of the strongest lines to be close to saturation. A higher microturbulent velocity could therefore help de-saturate the lines, which in turn would provide more reliable abundances. We therefore tested the impact of using Kurucz models with new opacity distributions, created with microturbulences of 2, 4, and 8 km s-1. The changes are not detectable for most of the lines we analyzed. A few of the stronger and more sensitive lines show changes of around 0.05 dex, and in these cases we produced lines where the Gaussian synthetic line profiles are better broadened and therefore fit the observed spectrum better. However, thermal broadening remains most important at these temperatures (which are also somewhat higher in RR Lyrae than in dwarfs and giants). Only the strongest lines like the Na D lines show very large differences when synthesized with a microturbulence of 8 km s-1 compared to 4 km s-1. These lines are affected by the outer regions of the stellar atmospheres, where the T-p (temperature-pressure) profiles of the different models (in ξmic) differ the most. The Na D lines were difficult to fit and are possibly saturated, therefore we do not give this result too much weight, which is why our [Na/Fe] is an upper limit.
4. Results and discussion
To understand the origin and enrichment of this high-velocity RR Lyrae star, we must first analyze and interpret our derived surface abundances. Evolved horizontal branch and RR Lyrae stars have proven to be trustworthy study cases in Galactic archeology studies (e.g., Tautvaisiene 1997; Preston et al. 2006; and the two most metal-poor RR lyrae stars studied by Hansen et al. 2011). However, when evolved and expanded giant stars move with high velocities through the ambient interstellar medium, they might become subject to mass loss if the outer layers are not strongly bound (this is, e.g., the case for the luminous low-gravity variable Mira stars, where material from the outer layers is removed by ram pressure stripping, e.g., Martin et al. 2007). Given the compactness of RR Lyrae stars, this is unlikely to be of a concern even in fast-moving objects. But before concluding based on the abundances, we now check whether pulsations combined with the high velocity can lead to mass loss from the stellar surface.
Escape velocity
Is material being stripped from this HVS RR Lyrae star, or does it stay bound? As mentioned in the introduction, the outermost 50% by radius of a typical RR Lyrae star contain ~0.001 M⊙, which could in principle be stripped from the star. If we assume a typical RR Lyrae star mass of 0.65–0.8 M⊙ and a radius of 4–6 R⊙, we adopt a mass of 0.7 M⊙ and a radius of 5 R⊙ (Smith 1995; Catelan 2015)2. These allow us to calculate the escape velocity from the stellar surface using 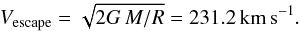 The expansion velocity of the outer layers can in turn be deduced from the change in velocity along the line of sight from phase 0 to 0.5, which corresponds to the change from minimum to maximum radius. According to the Liu (1991) pulsational velocity amplitude vs. V light amplitude relations, a velocity of ~90 km s-1 was estimated based on the V-band amplitude of m176 of 1.27 mag (see Fig. 1 in Liu). For m176, this value is therefore Vexpansion ~ 90 km s-1 (see Fig. 1 in Kunder et al. 2015). This means that Vexpansion ≪ Vescape and the surface material will stay bound owing to the relative compactness of this class of stars (as confirmed by earlier RR Lyrae star abundance studies). This confirms that the surface abundances reflect the original chemical composition and have not been stripped or altered by the combination of the pulsational and high spatial velocity of the star.
High-velocity stars
As mentioned in the introduction, the first HVSs to be detected were massive hot stars that originated from the Galactic center (Hills 1988). Recent studies (e.g., Palladino et al. 2014) have shown that low-mass F or G stars can also travel with extremely high velocities, often exceeding the local Galactic escape velocity. Thus, stars in a cluster or a binary system can be kicked out by a perturbation of the system, for instance, such as in a three-body encounter or a supernova explosion (e.g., Hoogerwerf et al. 2000; Perets 2009; Irrgang et al. 2010; Zhang et al. 2013). To be more specific, there are several possible formation scenarios for HVSs: (1) interaction of single stars with a central massive black hole (MBH); (2) tidal break-up of binary stars in the vicinity of a MBH; (3) three-body interactions involving single-star encounters with a binary or cluster of MBHs; (4) double detonation of SN Ia with a close system of a rapidly orbiting low-mass compact He star and a massive (~1−1.2 M⊙) CO-white dwarf (Geier et al. 2015); (5) single-degenerate SN type Ia consisting of a white dwarf and a main-sequence star (Liu et al. 2013); (6) binary star disruption in dense interacting regions such as globular clusters or the Galactic bulge or disk; or (7) tidal disruption of dwarf galaxies in the Galaxy (Li et al. 2015, and references therein). The last case would lead to old rapidly traveling stars.
In all the scenarios involving a binary system, we would expect some pollution or mass transfer to have taken place. This might change the original surface composition by enhancing the He, carbon, and possibly the neutron-capture element abundances. If the star were to be kicked out of a cluster, some slow neutron-capture pollution might be expected. We were unable to derive molecular or atomic C from the medium-resolution spectra because the star is warm (6600 K) and the blue spectra are very noisy, but our spectra would still have allowed us to detect significant C-enhancement. Moreover, the [Ba/Fe] abundance is low, and when comparing this to Fig. 5 in Stancliffe et al. (2013), the mass transfer, if it occurred, would have been much lower than 0.1 M⊙. This means that the surface composition of m1763 would only have been affected by a negligible amount in the measurable element abundances.
4.1. Metallicity: light curve vs. spectroscopic measurements
All of our spectroscopic measurements agree excellently well internally with each other: based on a representative number of 15 Fe I lines, we found [Fe/H] = −0.90 ± 0.2 dex, which compares to the well-calibrated Ca triplet measurement of [Fe/H]CaT = −0.85 ± 0.15 dex. In contrast, the photometrically derived metallicity values suggest that this star is considerably more metal-poor. A Fourier decomposition of the OGLE I-band light curve and the Smolec (2005) Fourier-[Fe/H] calibration yields a photometric metallicity of −1.26 dex on the Jurcsik & Kovacs (1996) metallicity scale, or −1.52 dex on the Carretta et al. (2009) metallicity scale. Kunder et al. (2015) performed a Fourier decomposition on the OGLE V-band light curve and used the widely adopted Jurcsik & Kovacs (1996) Fourier-[Fe/H] calibration to find a photometric metallicity of −1.62 dex on the Carretta et al. (2009) metallicity scale with a deviation parameter4Dm = 3.6. Jurcsik & Kovacs (1996) cautioned that relating physical stellar properties to Fourier parameters is applicable and reliable only if Dm< 3, although some studies have relaxed this criterion to Dm< 5 (e.g., Cacciari et al. 2005). The disagreement between the spectroscopic and photometric [Fe/H] may indicate that careful consideration of the deviation parameters of (bulge) RR Lyrae stars needs to be made, which is a limitation when using the Smolec (2005) calibration because it does not provide a way to calculate a deviation parameter and hence excludes such a sanity check. Ultimately, a larger sample of stars with well-determined spectroscopic metallicities is needed to clarify the discrepancy between our spectroscopic and the photometrically determined [Fe/H].
The accuracy of photometric metallicities derived from the light-curve Fourier parameters is not well established for the RR Lyrae population in the direction of the bulge. We note that ours is the first medium-resolution spectroscopic study of an RR Lyrae star in the direction of the Galactic bulge. Kunder & Chaboyer (2008) found that a star-to-star comparison between photometric metallicity of bulge RR Lyrae stars in Baade’s Window and those from low-resolution spectroscopic metallicities of Walker & Terndrup (1991) have a dispersion twice as large as would be expected from the Jurcsik & Kovacs (1996) calibrating sample. In contrast, the photometric [Fe/H] determinations of LMC stars compared to that of low-resolution spectroscopy agree to within 0.2 dex. It has also been shown that Fourier components of the light curves of RR Lyrae stars in the metal-rich bulge clusters NGC 6411 and NGC 6388 give photometric metallicity values that are 0.6 dex more metal-poor than is spectroscopically observed (Sandage 2004). This may indicate that RR Lyrae stars toward the direction of the bulge have properties distinct from the majority of local field RR Lyrae stars that make up the photometric [Fe/H] calibrating sample (e.g., different α-abundances, helium abundances, or evolutionary channel), rendering the photometric [Fe/H] values for these stars uncertain.
4.2. Chemical inferences on the birthplace of m176
Using the Besançon model of the Milky Way (Robin et al. 2003), we found that no halo RR Lyrae star more metal-rich than −1.3 dex should be found in this direction toward the bulge. As is known from stellar population synthesis, it is not as common for RR Lyrae to be produced in metal-rich systems, therefore the probability of metal-rich RR Lyrae to form in a metal-poor system like the halo is low (Lee 1992; Layden 1995). If this star is not a typical bulge object, but a halo star as indicated by kinematics, then the Galactic halo model implies that an RR Lyrae star with a relatively high metallicity so close to the bulge suggests that it could have an extragalactic origin.
The orbits presented in Kunder et al. (2015) seem to indicate that the star (m176) originated from the halo and is currently passing through the bulge. However, we do not know whether it came from the outer or inner halo, or if, as the authors suggest, the star is less likely to originate from the bulge. A low or high α-abundance allows us to distinguish between the outer- and inner-halo (Nissen & Schuster 2010) population. The inner halo shows a metallicity distribution function peaking around ⟨[Fe/H]⟩ ~ −1.6 with stars on prograde orbits that are thought to reflect the old(est) population of the Galaxy, while the outer halo is found to have an even lower mean metallicity with stars on retrograde orbits (Carollo et al. 2007). The latter could point toward stars being stripped from dwarf galaxies as a result of a galaxy merger, where smaller systems were absorbed into the Galaxy. In either case, the outer halo is today believed to be built up from smaller subsystems (Bullock & Johnston 2005), which would have limited gas resources, thus a different initial mass function for systems with a lower mass than that of the Milky Way. This would, in turn, lead to lower α-abundances (e.g., Kobayashi et al. 2006; Nissen & Schuster 2010). Similarly, the low star-forming efficiencies of the dwarf galaxy satellites in question lead to a downturn in the [α/Fe] ratios already at low [Fe/H], again leaving the impression of strong α-depletions toward higher metallicities (e.g., Matteucci & Brocato 1990; Tolstoy et al. 2009; Hendricks et al. 2014). Hence, a low [Mg/Fe] (~0.2 dex) in a star on retrograde orbits could point toward an external origin of a star that is now located in the outer halo, while a high (~0.4) [Mg/Fe] in a star on a prograde orbit would indicate an old population formed in situ (inner halo).
Nissen & Schuster (2010) presented a large sample of stars from the thick disk, inner and outer halo, all observed at high resolution. We compared the abundances of our RR Lyrae star (m176), which we showed to represent the original birth composition and remain unmodified by the stellar evolution and high velocity, to the study of Nissen & Schuster (2010). Figure 3 shows this comparison for [Mg/Fe] and [Si/Fe].
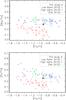 |
Fig. 3 Abundances of m176 compared to the high or low α abundances in (inner or outer) halo and thick-disk stars from Nissen & Schuster (2010, N10). |
This RR Lyrae star lies right between the inner-halo and thick-disk stars on one hand and the outer-halo stars on the other hand. In the [Mg/Fe] panel of Fig. 3 the RR Lyrae star (m176) might be slightly closer to the inner-halo and thick-disk stars. In Nissen et al. (2014) C and O abundances were presented for the same sample as published in their 2010 paper. The oxygen abundance we find fall ~0.4 dex below their lowest outer-halo O abundances. Hence, we need to consider the stellar kinematics to determine whether the star is moving on an prograde or retrograde orbit. As in Nissen & Schuster (2010), we constructed a Toomre diagram where we also compared to their data. The result is shown in Fig. 4, which clearly shows that m176 moves on a retrograde orbit that is even more extreme than that of the stars from Nissen & Schuster (2010). This indicates that the high-velocity RR Lyrae star m176 originated from a not-too-remote part of the outer halo (this is also feasible compared to the orbit predictions provided in Kunder et al. 2015). That the star moves with such a high velocity might indicate that it was originally kicked out from a binary system or that it is a result of a galaxy merger event, where a dwarf galaxy would be incorporated into the Milky Way and some of the dwarf’s stars would be stripped in the process. This could explain the kinematics and velocity of the RR Lyrae star m176.
According to de Boer et al. (2015), the first stripping from the Sagittarius (Sgr) dwarf galaxy resulted in stream stars with a mean metallicity of ~−1.5 around 11−13 Gyr ago, while a second, more metal-rich stream (~−0.7) is younger (~5 Gyr; see also Fellhauer et al. (2006)). RR Lyrae are generally old Pop II stars, which is consistent with them being stripped from a dwarf galaxy (e.g., Sgr) in an early merger event because the age (>10 Gyr) would allow the star to have been stripped early on. In addition to this, the earlier study by Monaco et al. (2007) showed that there is a southern and a northern stream that peak around ⟨[Fe/H]⟩ = −0.61 and ⟨[Fe/H]⟩ = −0.83, respectively.
Moreover, they also found an increasing α-abundance trend with decreasing metallicity for both the Sgr stream and the main body. Their [Mg/Fe] values span values from ~−0.3 to 0.4 dex. By combining the facts that RR Lyrae stars are thought to belong to an old population, that the Sgr stream consists of older and younger streams peaking at different mean metallicities close to the [Fe/H] = −0.9 we obtained for m176, and that positive (almost halo-like) [Mg/Fe] values can occur, the option of stripping from Sgr remains a viable origin of m176. An extragalactic origin has been proposed for peculiar HVSs in the Milky Way (Gualandris & Portegies Zwart 2007; but cf. Brown et al. 2010).
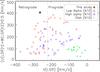 |
Fig. 4 Local standard of rest (LSR) velocities of m176 compared to the halo and thick-disk stars from Nissen & Schuster (2010, N10). |
Last, we consider that m176 is a normal RR Lyrae star located toward the direction of the bulge, which is on the tail of the RR Lyrae star velocity distribution. Its spectroscopic [Fe/H] is expected for a RR Lyrae stars located toward the bulge (e.g., Walker & Terndrup 1991; Pietrukowicz et al. 2015), as is its distance from the Galactic center. Although it has a halo-like orbit, it may well be that the majority of bulge RR Lyrae stars reside in an inner halo (e.g., Minniti et al. 1999; Kunder & Chaboyer 2008). This is also suggested by their spatial distribution (Dékány et al. 2013; although see also Pietrukowicz et al. 2015). A larger sample of spectroscopically well-studied bulge RR Lyrae stars and a larger sample of bulge RR Lyrae stars with space velocities is needed to address the uniqueness of this star.
5. Conclusion
The high-velocity RR Lyrae star m176 seems at first glance to be a normal halo star from a chemical perspective with a slight α-enhancement, a normal Cr and Ba abundance, and upper limits that agree well with our understanding of the halo stars and their chemical imprints. It is remarkable to find a variable star from an old population with a space velocity of −482 km s-1 with respect to the Galactic rest frame. It has completed many orbits of the bulge during its lifetime, hence repeated passages through or near the bulge, and yet, despite variability and high velocity, it preserved the original birth composition for the elements studied here.
The α-abundances agree well except for O, which needs to be consolidated from high-resolution follow-up spectroscopy. However, all α-abundances are ≤0.3dex, and combined with the LSR velocity, this indicates that the star is most likely a halo star on a retrograde orbit, which associates it with the outer halo. This star therefore might through stellar interaction originate from a binary system that interacted with a massive object, a binary system residing in a stellar cluster at the verge of the inner- or outer-halo region, or from dense parts of the bulge where interactions are more frequent. In all cases, a higher density will lead to more frequent interactions and a higher binary fraction.
The normal Ba abundance and the lack of C seems to contradict this explanation in terms of a binary origin. However, based on the metallicity and α-abundances, we cannot determine at this point if the star was stripped from a system in the halo or the bulge. Interactions with a binary system, stellar cluster, or a dense region in either of these two Galactic components could result in an HVS. Given the metallicity of ~−1 and the currently growing population of HVS RR Lyrae stars near the bulge, this would speak in favor of a bulge origin. Another possible explanation for the origin of m176 is that it was tidally stripped from a different galaxy (a dwarf or an early merger event such as Sgr), which is supported by the age and the stellar abundances (low O and Ti).
Higher resolution spectra of this star and other low-mass HVS stars would allow us to perform a more detailed abundance analysis, including weaker lines, of this and similar stars so that we could consider their formation and origin in more detail. This will be important to understand if there is a population of (HVS) RR lyrae stars in the bulge region.
Makee was developed by T. A. Barlow specifically to reduce Keck HIRES data. It is freely available online at the Keck Observatory home page, http://www.astro.caltech.edu/~tb/makee/
With these or slightly lower values we would obtain a log g of ~2.5, which is slightly higher than what we derive from the spectra. This is an expression of the few strong lines we had to rely on and the bias of LTE Fe abundances.
This star may be part of the high-velocity dispersion subgroup of RR Lyrae stars in the bulge (Kunder et al. 2016, in press).
Dm is defined as | Fobs−Fcalc | /σ, where Fobs is the observed value for any given Fourier parameter, Fcalc is the predicted value based on the remaining parameters, and σ is the observed standard deviation in F.
Acknowledgments
C.J.H. acknowledges support from research grant VKR023371 from the Villum Foundation. We thank the anonymous referee for comments, and G. Wallerstein, R. Stancliffe and A. Ruiter for useful discussions. R.M.R. acknowledges support from the NSF grant AST-1413755. A.K. thanks the Deutsche Forschungsgemeinschaft for funding from Emmy Noether grant Ko 4161/1. H.G.L. acknowledges financial support by the Sonderforschungsbereich SFB 881 “The Milky Way System” (subproject A4) of the German Research Foundation (DFG). The authors wish to recognize and acknowledge the very significant cultural role and reverence that the summit of Mauna Kea has always had within the indigenous Hawaiian community. We are most fortunate to have the opportunity to conduct observations from this mountain.
References
- Allen de Prieto, C., Barklem, P. S., Lambert, D. L., & Cunha, K. 2004, A&A, 420, 183 [NASA ADS] [CrossRef] [EDP Sciences] [Google Scholar]
- Amarsi, A. M., Asplund, M., Collet, R., & Leenaarts, J. 2016, MNRAS, 455, 3735 [NASA ADS] [CrossRef] [Google Scholar]
- Bergemann, M., Hansen, C. J., Bautista, M., & Ruchti, G. 2012, A&A, 546, A90 [NASA ADS] [CrossRef] [EDP Sciences] [Google Scholar]
- Brown, W. R. 2015, ARA&A, 53, 15 [Google Scholar]
- Brown, T. M., Ferguson, H. C., Smith, E., et al. 2004, AJ, 127, 2738 [NASA ADS] [CrossRef] [Google Scholar]
- Brown, W. R., Anderson, J., Gnedin, O. Y., et al. 2010, ApJ, 719, L23 [NASA ADS] [CrossRef] [Google Scholar]
- Bullock, J. S., & Johnston, K. V. 2005, ApJ, 635, 931 [NASA ADS] [CrossRef] [Google Scholar]
- Cacciari, C., Corwin, T. M., & Carney, B. W. 2005, AJ, 129, 267 [NASA ADS] [CrossRef] [Google Scholar]
- Caffau, E., Ludwig, H.-G., Steffen, M., et al. 2008, A&A, 488, 1031 [CrossRef] [EDP Sciences] [Google Scholar]
- Carollo, D., Beers, T. C., Lee, Y. S., et al. 2007, Nature, 450, 1020 [NASA ADS] [CrossRef] [PubMed] [Google Scholar]
- Carretta, E., Bragaglia, A., Gratton, R., D’Orazi, V., & Lucatello, S. 2009, A&A, 508, 695 [NASA ADS] [CrossRef] [EDP Sciences] [Google Scholar]
- Casey, A. R., & Schlaufman, K. C. 2015, ApJ, 809, 110 [NASA ADS] [CrossRef] [Google Scholar]
- Castelli, F., & Kurucz, R. L. 2003, in Modelling of Stellar Atmospheres, eds. N. Piskunov, W. W. Weiss, & D. F. Gray, IAU Symp., 210, 20 [Google Scholar]
- Catelan, M., & Smith, S. H. A. 2015, Pulsating stars (Wiley-VCH) [Google Scholar]
- Cayrel, R., Depagne, E., Spite, M., et al. 2004, A&A, 416, 1117 [NASA ADS] [CrossRef] [EDP Sciences] [Google Scholar]
- Clementini, G., Carretta, E., Gratton, R., et al. 1995, AJ, 110, 2319 [NASA ADS] [CrossRef] [Google Scholar]
- Da Costa, G. S., Rejkuba, M., Jerjen, H., & Grebel, E. K. 2010, ApJ, 708, L121 [NASA ADS] [CrossRef] [Google Scholar]
- de Boer, T. J. L., Belokurov, V., & Koposov, S. 2015, MNRAS, 451, 3489 [NASA ADS] [CrossRef] [Google Scholar]
- Dékány, I., Minniti, D., Catelan, M., et al. 2013, ApJ, 776, L19 [NASA ADS] [CrossRef] [Google Scholar]
- Demarque, P., Woo, J.-H., Kim, Y.-C., & Yi, S. K. 2004, ApJS, 155, 667 [NASA ADS] [CrossRef] [Google Scholar]
- Fellhauer, M., Belokurov, V., Evans, N. W., et al. 2006, ApJ, 651, 167 [NASA ADS] [CrossRef] [Google Scholar]
- For, B.-Q., Sneden, C., & Preston, G. W. 2011, ApJS, 197, 29 [NASA ADS] [CrossRef] [Google Scholar]
- Fulbright, J. P., McWilliam, A., & Rich, R. M. 2007, ApJ, 661, 1152 [NASA ADS] [CrossRef] [Google Scholar]
- Gallagher, A. J., Ryan, S. G., Hosford, A., et al. 2012, A&A, 538, A118 [NASA ADS] [CrossRef] [EDP Sciences] [Google Scholar]
- Geier, S., Fürst, F., Ziegerer, E., et al. 2015, Science, 347, 1126 [NASA ADS] [CrossRef] [Google Scholar]
- Gomez, T., Wallerstein, G., Huang, W., et al. 2011, in BAAS, 43, 217 [Google Scholar]
- Gualandris, A., & Portegies Zwart, S. 2007, MNRAS, 376, L29 [NASA ADS] [CrossRef] [Google Scholar]
- Hansen, C. J., Nordström, B., Bonifacio, P., et al. 2011, A&A, 527, A65 [NASA ADS] [CrossRef] [EDP Sciences] [Google Scholar]
- Hansen, C. J., Bergemann, M., Cescutti, G., et al. 2013, A&A, 551, A57 [NASA ADS] [CrossRef] [EDP Sciences] [Google Scholar]
- Haschke, R., Grebel, E. K., Frebel, A., et al. 2012, AJ, 144, 88 [NASA ADS] [CrossRef] [Google Scholar]
- Hendricks, B., Koch, A., Lanfranchi, G. A., et al. 2014, ApJ, 785, 102 [NASA ADS] [CrossRef] [Google Scholar]
- Hills, J. G. 1988, Nature, 331, 687 [Google Scholar]
- Hoogerwerf, R., de Bruijne, J. H. J., & de Zeeuw, P. T. 2000, ApJ, 544, L133 [NASA ADS] [CrossRef] [Google Scholar]
- Howes, L. M., Casey, A. R., Asplund, M., et al. 2015, Nature, 527, 484 [NASA ADS] [CrossRef] [Google Scholar]
- Irrgang, A., Przybilla, N., Heber, U., Nieva, M. F., & Schuh, S. 2010, ApJ, 711, 138 [NASA ADS] [CrossRef] [Google Scholar]
- Ivans, I. I., Simmerer, J., Sneden, C., et al. 2006, ApJ, 645, 613 [NASA ADS] [CrossRef] [Google Scholar]
- Johnson, C. I., Rich, R. M., Kobayashi, C., et al. 2013, ApJ, 765, 157 [NASA ADS] [CrossRef] [Google Scholar]
- Johnson, C. I., Rich, R. M., Kobayashi, C., Kunder, A., & Koch, A. 2014, AJ, 148, 67 [NASA ADS] [CrossRef] [Google Scholar]
- Jurcsik, J., & Kovacs, G. 1996, A&A, 312, 111 [NASA ADS] [Google Scholar]
- Kinemuchi, K., Smith, H. A., Woźniak, P. R., McKay, T. A., & ROTSE Collaboration 2006, AJ, 132, 1202 [NASA ADS] [CrossRef] [Google Scholar]
- Kobayashi, C., Umeda, H., Nomoto, K., Tominaga, N., & Ohkubo, T. 2006, ApJ, 653, 1145 [NASA ADS] [CrossRef] [Google Scholar]
- Koch, A., McWilliam, A., Preston, G. W., & Thompson, I. B. 2016, A&A, 587, A124 [Google Scholar]
- Kolenberg, K., Fossati, L., Shulyak, D., et al. 2010, A&A, 519, A64 [NASA ADS] [CrossRef] [EDP Sciences] [Google Scholar]
- Kollmeier, J. A., Gould, A., Rockosi, C., et al. 2010, ApJ, 723, 812 [NASA ADS] [CrossRef] [Google Scholar]
- Kunder, A., & Chaboyer, B. 2008, AJ, 136, 2441 [NASA ADS] [CrossRef] [Google Scholar]
- Kunder, A., Koch, A., Rich, R. M., et al. 2012, AJ, 143, 57 [NASA ADS] [CrossRef] [Google Scholar]
- Kunder, A., Rich, R. M., Hawkins, K., et al. 2015, ApJ, 808, L12 [NASA ADS] [CrossRef] [Google Scholar]
- Kunder, A., Rich, R. M., Storm, J., et al. 2016, ApJ, 821, L25 [NASA ADS] [CrossRef] [Google Scholar]
- Lawler, J. E., Wickliffe, M. E., den Hartog, E. A., & Sneden, C. 2001, ApJ, 563, 1075 [CrossRef] [Google Scholar]
- Layden, A. C. 1995, AJ, 110, 2312 [NASA ADS] [CrossRef] [Google Scholar]
- Layden, A. C., Hanson, R. B., Hawley, S. L., Klemola, A. R., & Hanley, C. J. 1996, AJ, 112, 2110 [NASA ADS] [CrossRef] [Google Scholar]
- Lee, Y.-W. 1992, AJ, 104, 1780 [NASA ADS] [CrossRef] [Google Scholar]
- Li, H., Aoki, W., Zhao, G., et al. 2015, PASJ, 67, 84 [NASA ADS] [CrossRef] [Google Scholar]
- Liu, T. 1991, PASP, 103, 205 [NASA ADS] [CrossRef] [Google Scholar]
- Liu, Z.-W., Pakmor, R., Röpke, F. K., et al. 2013, A&A, 554, A109 [NASA ADS] [CrossRef] [EDP Sciences] [Google Scholar]
- Martin, D. C., Seibert, M., Neill, J. D., et al. 2007, Nature, 448, 780 [NASA ADS] [CrossRef] [PubMed] [Google Scholar]
- Matteucci, F., & Brocato, E. 1990, ApJ, 365, 539 [NASA ADS] [CrossRef] [Google Scholar]
- Minniti, D., Alcock, C., Allsman, R. A., et al. 1999, in The Third Stromlo Symposium: The Galactic Halo, eds. B. K. Gibson, R. S. Axelrod, & M. E. Putman, ASP Conf. Ser., 165, 284 [Google Scholar]
- Monaco, L., Bellazzini, M., Bonifacio, P., et al. 2007, A&A, 464, 201 [NASA ADS] [CrossRef] [EDP Sciences] [Google Scholar]
- Ness, M., Freeman, K., Athanassoula, E., et al. 2013, MNRAS, 430, 836 [NASA ADS] [CrossRef] [Google Scholar]
- Nidever, D. L., Zasowski, G., Majewski, S. R., et al. 2012, ApJ, 755, L25 [Google Scholar]
- Nissen, P. E., & Schuster, W. J. 2010, A&A, 511, L10 [NASA ADS] [CrossRef] [EDP Sciences] [Google Scholar]
- Nissen, P. E., Chen, Y. Q., Carigi, L., Schuster, W. J., & Zhao, G. 2014, A&A, 568, A25 [NASA ADS] [CrossRef] [EDP Sciences] [Google Scholar]
- Palladino, L. E., Schlesinger, K. J., Holley-Bockelmann, K., et al. 2014, ApJ, 780, 7 [NASA ADS] [CrossRef] [Google Scholar]
- Perets, H. B. 2009, ApJ, 698, 1330 [NASA ADS] [CrossRef] [Google Scholar]
- Pietrukowicz, P., Kozłowski, S., Skowron, J., et al. 2015, ApJ, 811, 113 [NASA ADS] [CrossRef] [Google Scholar]
- Preston, G. W. 2011, AJ, 141, 6 [NASA ADS] [CrossRef] [Google Scholar]
- Preston, G. W., Sneden, C., Thompson, I. B., Shectman, S. A., & Burley, G. S. 2006, AJ, 132, 85 [NASA ADS] [CrossRef] [Google Scholar]
- Robin, A. C., Reylé, C., Derrière, S., & Picaud, S. 2003, A&A, 409, 523 [NASA ADS] [CrossRef] [EDP Sciences] [Google Scholar]
- Sandage, A. 2004, AJ, 128, 858 [NASA ADS] [CrossRef] [Google Scholar]
- Schörck, T., Christlieb, N., Cohen, J. G., et al. 2009, A&A, 507, 817 [NASA ADS] [CrossRef] [EDP Sciences] [Google Scholar]
- Sheinis, A. I., Bolte, M., Epps, H. W., et al. 2002, PASP, 114, 851 [NASA ADS] [CrossRef] [Google Scholar]
- Smith, H. A. 1995, Cambridge Astrophys. Ser., 27 [Google Scholar]
- Smolec, R. 2005, Acta Astron., 55, 59 [NASA ADS] [Google Scholar]
- Sneden, C., Lucatello, S., Ram, R. S., Brooke, J. S. A., & Bernath, P. 2014, ApJS, 214, 26 [Google Scholar]
- Sneden, C. A. 1973, Ph.D. Thesis, The University of Texas at Austin [Google Scholar]
- Soszyński, I., Udalski, A., Szymański, M. K., et al. 2014, Acta Astron., 64, 177 [NASA ADS] [Google Scholar]
- Stancliffe, R. J., Kennedy, C. R., Lau, H. H. B., & Beers, T. C. 2013, MNRAS, 435, 698 [NASA ADS] [CrossRef] [Google Scholar]
- Steffen, M., Prakapavičius, D., Caffau, E., et al. 2015, A&A, 583, A57 [NASA ADS] [CrossRef] [EDP Sciences] [Google Scholar]
- Tautvaisiene, G. 1997, MNRAS, 286, 948 [NASA ADS] [CrossRef] [Google Scholar]
- Tolstoy, E., Hill, V., & Tosi, M. 2009, ARA&A, 47, 371 [NASA ADS] [CrossRef] [Google Scholar]
- Tumlinson, J. 2010, ApJ, 708, 1398 [NASA ADS] [CrossRef] [Google Scholar]
- Walker, A. R., & Terndrup, D. M. 1991, ApJ, 378, 119 [NASA ADS] [CrossRef] [Google Scholar]
- Wallerstein, G., Gomez, T., & Huang, W. 2012, Ap&SS, 341, 89 [NASA ADS] [CrossRef] [Google Scholar]
- Yong, D., Norris, J. E., Bessell, M. S., et al. 2013, ApJ, 762, 26 [NASA ADS] [CrossRef] [Google Scholar]
- Zhang, Z., Gilfanov, M., & Bogdán, Á. 2013, A&A, 556, A9 [NASA ADS] [CrossRef] [EDP Sciences] [Google Scholar]
Appendix
Atomic data for lines investigated: Wavelength, atomic number, ionisation, and isotope, excitation potential, and log gf.
All Tables
Date of observation, coordinates, heliocentric Julian date (HJD), integration times, and phase for m176.
Atomic data for lines investigated: Wavelength, atomic number, ionisation, and isotope, excitation potential, and log gf.
All Figures
|
Fig. 1 Spectral region of m176 around the Mg triplet. Overall the fit is acceptable, but we are biased toward measuring strong lines that do not always yield the same abundance as weaker lines. A few of the weaker but blended Fe lines are shown here and marked with an asterisk (the two reddest lines). |
| In the text | |
|
Fig. 2 Abundances of m176 compared to other RR Lyrae stars observed in a similar phase (around minimum light) and bulge stars. The RR lyrae star studies shown are Clementini et al. (1995), For et al. (2011), Hansen et al. (2011), Kolenberg et al. (2010), Haschke et al. (2012), and Johnson et al. (2013) as bulge comparison sample. |
| In the text | |
|
Fig. 3 Abundances of m176 compared to the high or low α abundances in (inner or outer) halo and thick-disk stars from Nissen & Schuster (2010, N10). |
| In the text | |
|
Fig. 4 Local standard of rest (LSR) velocities of m176 compared to the halo and thick-disk stars from Nissen & Schuster (2010, N10). |
| In the text | |
Current usage metrics show cumulative count of Article Views (full-text article views including HTML views, PDF and ePub downloads, according to the available data) and Abstracts Views on Vision4Press platform.
Data correspond to usage on the plateform after 2015. The current usage metrics is available 48-96 hours after online publication and is updated daily on week days.
Initial download of the metrics may take a while.