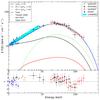
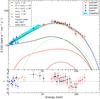
Fig. 8

Top panel: synthesis of the CXB spectrum and residuals (in unit of χ2) obtained using the best fit NH distribution derived with the selection of Table 5, row 1. Bottom panel: as in the top panel, but using the NH distribution corresponding to the 1σ upper limit of the CTK fraction. Previously published CXB synthesis from T09, G07, and U14 (dotted lines) are also shown.
Current usage metrics show cumulative count of Article Views (full-text article views including HTML views, PDF and ePub downloads, according to the available data) and Abstracts Views on Vision4Press platform.
Data correspond to usage on the plateform after 2015. The current usage metrics is available 48-96 hours after online publication and is updated daily on week days.
Initial download of the metrics may take a while.