Free Access
Fig. 7
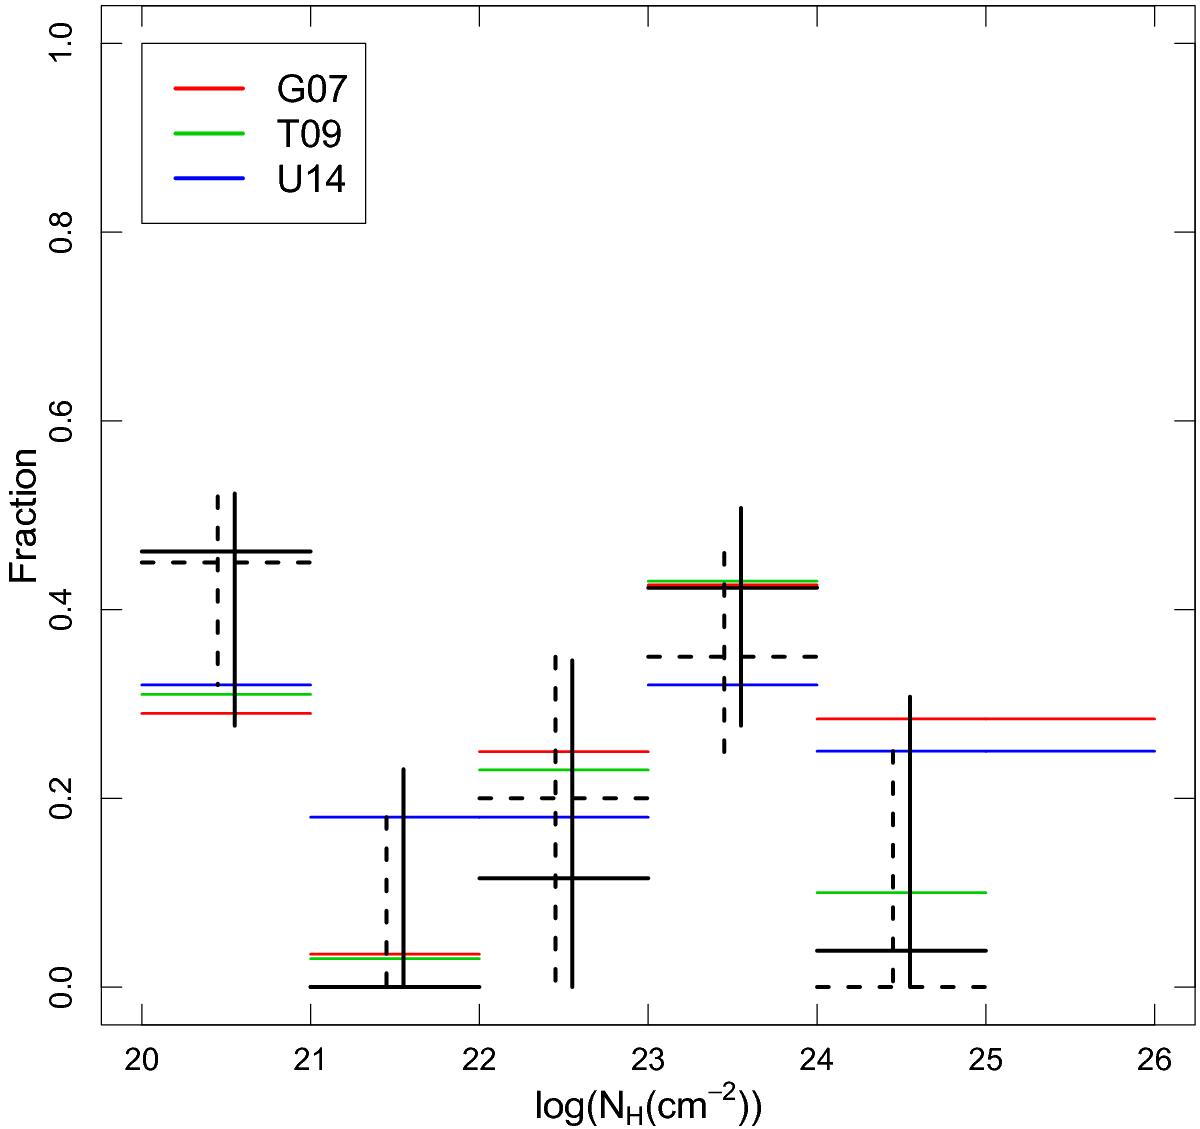
Best fit NH distribution with U14 XLF (continuous black lines) and U03 (dashed black lines) compared with NH distribution from previous works. Error bars show the 1σ confidence region. To compare better with previous works, here the NH distributions are renormalised up to NH= 1024 cm-2.
Current usage metrics show cumulative count of Article Views (full-text article views including HTML views, PDF and ePub downloads, according to the available data) and Abstracts Views on Vision4Press platform.
Data correspond to usage on the plateform after 2015. The current usage metrics is available 48-96 hours after online publication and is updated daily on week days.
Initial download of the metrics may take a while.