Free Access
Fig. 3
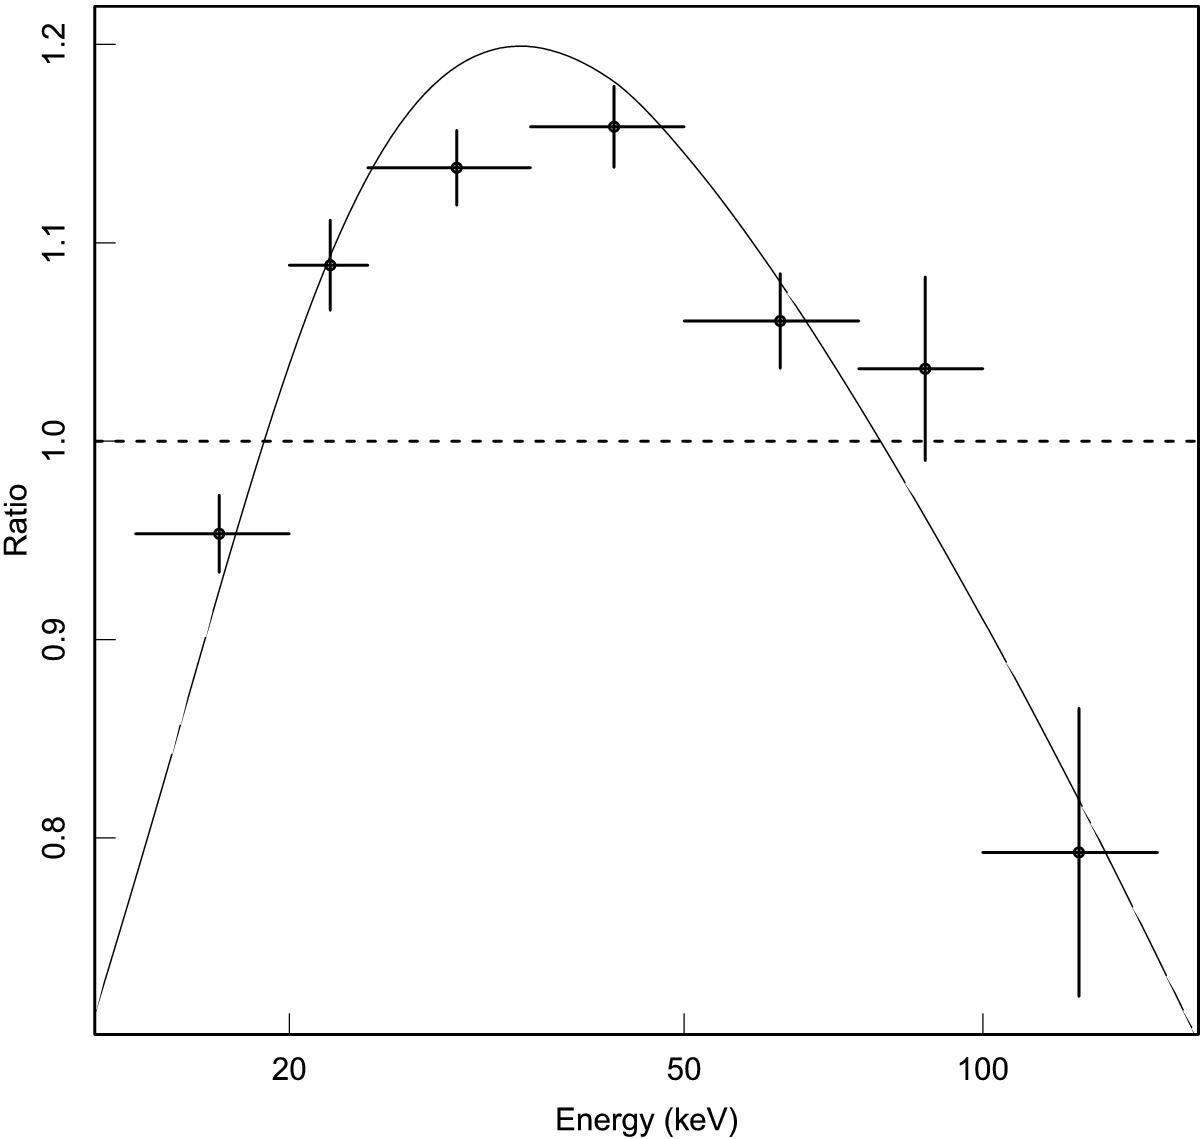
Ratio of MOB versus LOB1 spectra. The spectra are derived from the samples based on NH definition. The curve is the ratio between the two best fit models fitted with the pexrav model.
Current usage metrics show cumulative count of Article Views (full-text article views including HTML views, PDF and ePub downloads, according to the available data) and Abstracts Views on Vision4Press platform.
Data correspond to usage on the plateform after 2015. The current usage metrics is available 48-96 hours after online publication and is updated daily on week days.
Initial download of the metrics may take a while.