| Issue |
A&A
Volume 590, June 2016
|
|
|---|---|---|
| Article Number | A5 | |
| Number of page(s) | 16 | |
| Section | Extragalactic astronomy | |
| DOI | https://doi.org/10.1051/0004-6361/201527228 | |
| Published online | 28 April 2016 | |
Supernova 2010ev: A reddened high velocity gradient type Ia supernova⋆
1
Millennium Institute of Astrophysics, Casilla 36-D, Santiago
Chile
e-mail: This email address is being protected from spambots. You need JavaScript enabled to view it.
2
Departamento de Astronomía, Universidad de Chile,
Casilla 36-D, Santiago, Chile
3
European Southern Observatory, Alonso de Córdova 3107, Casilla 19 001,
Santiago 19,
Chile
4
Instituto de Astrofísica de La Plata (IALP,
CONICET), 1467
La Plata Argentina
5
Departamento de Ciencias Fisicas, Universidad Andres
Bello, Avda. República
252, Santiago,
Chile
6
Carnegie Observatories, Las Campanas Observatory,
Casilla 601, La Serena, Chile
7
Department of Physics and Astronomy, Aarhus
University, Ny Munkegade
120, 8000
Aarhus C,
Denmark
8
Max-Planck-Institut für Astrophysik, Karl-Schwarzschild-Str. 1, 85741
Garching,
Germany
9
European Southern Observatory, Karl-Schwarzschild-Str. 2, 85748
Garching,
Germany
10
INAF − Osservatorio Astrofisico di Catania,
Via Santa Sofia, 78,
95123, Catania, Italy
11
University of North Carolina at Chapel Hill,
Campus Box 3255, Chapel Hill, NC
27599-3255,
USA
Received:
21
August
2015
Accepted:
1
February
2016
Abstract
Aims. We present and study the spectroscopic and photometric evolution of the type Ia supernova (SN Ia) 2010ev.
Methods. We obtain and analyze multiband optical light curves and optical/near-infrared spectroscopy at low and medium resolution spanning −7 days to +300 days from the B-band maximum.
Results. A photometric analysis shows that SN 2010ev is a SN Ia of normal brightness with a light-curve shape of Δm15(B) = 1.12 ± 0.02 and a stretch s = 0.94 ± 0.01 suffering significant reddening. From photometric and spectroscopic analysis, we deduce a color excess of E(B − V) = 0.25 ± 0.05 and a reddening law of Rv = 1.54 ± 0.65. Spectroscopically, SN 2010ev belongs to the broad-line SN Ia group, showing stronger than average Si iiλ6355 absorption features. We also find that SN 2010ev is a high velocity gradient SN with v̇Si = 164 ± 7 km s-1 d-1. The photometric and spectral comparison with other supernovae shows that SN 2010ev has similar colors and velocities to SN 2002bo and SN 2002dj. The analysis of the nebular spectra indicates that the [Fe ii]λ7155 and [Ni ii]λ7378 lines are redshifted, as expected for a high velocity gradient supernova. All these common intrinsic and extrinsic properties of the high velocity gradient (HVG) group are different from the low velocity gradient (LVG) normal SN Ia population and suggest significant variety in SN Ia explosions.
Key words: supernovae: general / supernovae: individual: SN 2010ev
This paper includes data gathered with the Du Pont Telescope at Las Campanas Observatory, Chile; and the Gemini Observatory, Cerro Pachon, Chile (Gemini Program GS-2010A-Q-14). Based on observations collected at the European Organisation for Astronomical Research in the Southern Hemisphere, Chile (ESO Programme 085.D-0577).
© ESO, 2016
1. Introduction
Type Ia supernovae (SNe Ia) play an important role in stellar evolution and in the chemical enrichment of the Universe and in the determination of extragalactic distances owing to the relation between the decline rate of the light curve and its peak luminosity (Phillips 1993; Hamuy et al. 1996; Phillips et al. 1999) and between color and peak luminosity (Tripp 1998). SNe Ia represent a homogeneous class and are thought to arise from the thermonuclear explosion of a carbon-oxygen white dwarf either triggered by the interaction with the companion in a close binary system (Hoyle & Fowler 1960) or by direct collisions of white dwarfs. (Raskin et al. 2009). In the leading scenario of a close binary system, the nature of the explosion and companion star is still debated. Two of the models considered are the single degenerate (SD; Nomoto 1982; Iben & Tutukov 1984) and the double degenerate (DD) scenario (Iben & Tutukov 1984; Webbink 1984). In the former, a white dwarf accretes matter from the companion, which can be a subgiant or main-sequence star, while in the latter the SN is produced by the merging of two white dwarfs. SNe Ia are thought to explode near the Chandrasekhar mass, although recent simulations of sub-Chandrasekhar mass explosions have been successful for both scenarios (Sim et al. 2012; Kromer et al. 2010; Pakmor et al. 2012).
The study of SN Ia spectral and photometric parameters in both early and late epochs can give key indications about the nature of the explosion. Studies of SN Ia spectroscopic properties reveal significant diversity among the population. Benetti et al. (2005) defined a subclassification of SNe Ia based on expansion velocities, line ratios and light-curve decline rates. These authors classified the SN Ia population into three different subgroups: high velocity gradient (HVG), low velocity gradient (LVG) and FAINT objects. A parallel classification was proposed by Branch et al. (2006), based on absorption equivalent widths of Si iiλ5972 and λ6355 lines at maximum, which defines four subtypes: core-normal (CN), broad-line (BL), cool (CL) and shallow silicon (SS). Wang et al. (2009) classified their SNe Ia sample into two groups based on the blueshifted velocity of Si ii absorption lines at maximum: normal velocity (NV; v ~ 10 500 km s-1) and high velocity (HV; v ≥ 12 000 km s-1) SNe. Contemporary analyses of large samples of SNe Ia spectra (e.g. Branch et al. 2009; Blondin et al. 2012; Silverman et al. 2012, 2013; Silverman & Filippenko 2012; Folatelli et al. 2013) have confirmed this diversity and suggest that it could be key to understanding the explosion mechanism(s). In fact, Maeda et al. (2010a) proposed an explanation in which velocity gradients vary as a consequence of different viewing directions toward an aspherical explosion scenario. Nebular [Fe ii]λ7155 and [Ni ii]λ7378 Å lines are redshifted and are generally associated with HVG SNe, while blueshifted lines correspond to LVG SNe.
Recent observational evidence suggests the presence of circumstellar material (CSM) around SN Ia progenitors, which in principle could favor the SD model (Raskin et al. 2014), but some DD models have also presented CSM (Shen et al. 2013). In observed spectra, the temporal evolution in the narrow Na I D lines has been attributed to CSM (Patat et al. 2007; Simon et al. 2009; Blondin et al. 2009) and the fact that these lines have an excess of blueshifts (Sternberg et al. 2011; Maguire et al. 2013; Phillips et al. 2013).
It has been suggested that such nearby CSM could affect the colors of SNe Ia (Goobar 2008; Förster et al. 2013), although other studies suggest that the dust responsible for the observed reddening of SNe Ia is predominantly located in the interstellar medium (ISM) of the host galaxies and not in the CSM associated with the progenitor system (e.g. Phillips et al. 2013).
In this paper, we present the optical photometry and optical/near-infrared spectroscopy of SN 2010ev, a red SN with normal brightness. We discuss its characteristics and we compare it with other similar events. The paper is organized as follows: A description of the observations and data reduction are presented in Sect. 2. The photometry and spectroscopy are analyzed in Sect. 3. In Sect. 4 we present the discusion, and we provide our conclusions in Sect. 5.
2. Observations and data reduction
SN 2010ev was discovered by the Chilean Automatic Supernova Search (CHASE) program on June
27.5 UT (Pignata et al. 2010) in the spiral galaxy NGC 3244
( ,
,  ). The SN lies
 east and
 south of the center of the host galaxy
(see Fig. 1). Optical spectra of the SN 2010ev were
obtained three days after discovery on June 30.9 UT with the Gemini South (GMOS-S) telescope by Stritzinger (2010). The spectrum revealed that SN 2010ev
was a young (~7 days before
maximum) SN Ia. Details on SN 2010ev and its host-galaxy properties are summarized in Table
1.
south of the center of the host galaxy
(see Fig. 1). Optical spectra of the SN 2010ev were
obtained three days after discovery on June 30.9 UT with the Gemini South (GMOS-S) telescope by Stritzinger (2010). The spectrum revealed that SN 2010ev
was a young (~7 days before
maximum) SN Ia. Details on SN 2010ev and its host-galaxy properties are summarized in Table
1.
Main parameters of SN 2010ev and its host galaxy.
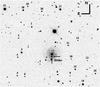 |
Fig. 1 Finding chart showing the position of SN 2010ev and that of the local sequence stars used for photometric calibration. The image was taken with PROMPT1 and covers an area of about 8′× 7′. The crosshair indicates the position of the supernova. |
2.1. Optical photometry
Optical imaging of SN 2010ev was acquired with the PROMPT1, PROMPT3 and PROMPT5 telescopes located at Cerro Tololo Interamerican Observatory, FORS2 at the ESO Very Large Telescope (VLT) and IMACS at Las Campanas Observatory. The PROMPT telescopes are equipped with an Apogee Alta U47 E2V CCD47-10 CCD camera (1024 × 1024, pixel scale = 0.6′′ per pixel). With PROMPT1, SN 2010ev was observed with the B, V, R, and I Johnson-Kron-Cousins filters, with PROMPT3, SN 2010ev was observed with the B filter and Sloan u′, g′ filters, and in PROMPT5 using V, R, and I and r′, i′, and z′ filters.
Spectroscopic observations of SN 2010ev.
Since the PROMPT cameras operate between −20 and −30 degrees Celsius, all optical images were dark subtracted to remove the dark current. After flat-field corrections all images taken with a given filter were registered and stacked to produce a final deeper image. We computed PSF photometry of the supernova relative to a sequence of stars located close to the SN but not contaminated by host galaxy light (see Fig. 1). The photometric sequence itself was calibrated to the standard Johnson Kron-Cousins and Sloan photometric systems using observations of photometric standard stars (Landolt 1992, 2007; Smith et al. 2002). The BVRI and u′g′r′i′z′ magnitudes of the local sequence are reported in Table A.1.
Given that SN 2010ev exploded in a region of significant background galaxy flux, it was necessary to apply galaxy template subtractions to all of the optical images. Three template images for each filter were acquired with the PROMPT telescopes between 2012 January 24–30, i.e. more than 565 days after B maximum brightness. This give us confidence that the residual SN flux on the template images is negligible. Each flux measurement was computed as a weighted average of the values obtained from the three templates. To account for the error introduced by the templates, we added, in quadrature, the rms flux computed from the three measurements with errors obtained from the PSF fitting and flux calibration. In Table A.2, we report the BVRI and u′g′r′i′z′ photometry of SN 2010ev, together with their uncertainties.
2.2. Optical and near-infrared spectroscopy
Optical spectra were obtained at 16 epochs spanning phases between −6 and + 270 days with respect to B-band maximum. These observations were acquired with four different instruments: X-Shooter and FORS2 at ESO Very Large Telescope (VLT), GMOS-S at Gemini Observatory and the WFCCD at the Du Pont Telescope of Las Campanas Observatory. Near-infrared spectra were obtained with X-Shooter covering nine epochs from −6 to + 15 days. A log of the spectroscopic observations of SN 2010ev is reported in Table 2.
Data reduction for GMOS-S, WFCCD, and FORS2 were performed with IRAF1 using the standard routines (bias subtraction, flat-field correction, 1D extraction, and wavelength calibration), while for X-Shooter the dedicated pipeline (Modigliani et al. 2010) was employed for most of the process, leaving the telluric line correction and flux calibration to be carried out with IRAF. To remove the telluric optical and near-infrared (NIR) features, the SN spectrum was divided by the standard star spectrum observed during the same night. The SN spectra were flux-calibrated using response curves acquired from the spectra of standard stars.
3. Results
In this section we show the spectral and photometric results obtained for SN 2010ev. The principal measurements are compared with other well-studied SNe Ia that have similar characteristics, such as colors, line ratios and velocities. To interpret our observations and results, we compare them with the Hsiao SN Ia spectral template (Hsiao et al. 2007; hereafter H07) and synthetic spectra computed from a delayed-detonation model (Blondin et al. 2015; hereafter “B15”2). Hsiao et al. (2007) use a sample of 28 SNe Ia to characterize the spectral features and identify patterns in the data with principal component analysis (PCA). Overall, these SNe show normal features. Meanwhile, the B15 model is the result of a 1D nonlocal thermodynamic equilibrium radiative transfer simulation of a Chandrasekhar mass delayed-detonation model with 0.51 M⊙ of 56Ni, which closely matches SN 2002bo. This model provides a reference for understanding SNe Ia similar to that prototype, as is the case for SN 2010ev. Thus, we compare our results with the H07 template and the B15 model.
3.1. Light curves
SN 2010ev was observed in BVRI and u′g′r′i′z′ bands. We have performed light-curve fits to the multiwavelength photometry of SN 2010ev. For this purpose, we use SNooPy (Burns et al. 2011) and SiFTO (Conley et al. 2008) light-curve fitters. Figure 2 shows the BVRI and u′g′r′i′z′ light curves with both fits. This SN shows a normal decline rate, Δm15(B) = 1.12 ± 0.02 and a stretch parameter s = 0.94 ± 0.01. This Δm15(B) is similar to those found in high velocity gradient SNe (HVG), such as SN 2002bo (Δm15(B) = 1.13 ± 0.02) and SN 2002dj (Δm15(B) = 1.08 ± 0.02).
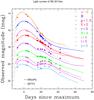 |
Fig. 2 BVRI and u′g′r′i′z′ light curves of SN 2010ev. The SNooPy fits are shown with solid lines while the SiFTO fits are shown with dotted lines. The light curves have been shifted by the amount shown in the label. |
Using SNooPy we obtain a peak B-band magnitude Bmax = 14.94 ± 0.02 on JD = 2 455 384.60 ± 0.30 (2010 July 7.1 UT), which indicates that SN 2010ev was observed in BVRI and u′g′r′i′z′ from −7.5 to 289.5 days with respect to maximum light. The peak VRI magnitudes are Vmax = 14.98 ± 0.02, Rmax = 14.45 ± 0.02, and Imax = 14.56 ± 0.01, which occur at −1, 1, and −2 days with respect to Bmax. The I and i′ bands show a secondary maximum at ~20−25 days after B maximum, while R and r′ bands show a shoulder at those times. The main photometric parameters of SN 2010ev are reported in Table 1.
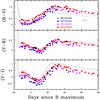 |
Fig. 3 Color evolution of SN 2010ev compared with high velocity gradient (HVG) SNe Ia: SN 2002bo, SN 2002dj, and SN 2002er. The SN colors have been dereddened for MW extinction only. We also show the colors of the B15 model without extinction (solid gray line) and with the host extinction (dashed gray line) obtained in Sect. 3.6. |
During the nebular phase the BVRI magnitudes follow a linear decline due to the exponentially decreasing rate of energy input by radioactive decay: 1.63 ± 0.03, 1.15 ± 0.02, 1.16 ± 0.05, 0.83 ± 0.02 magnitudes per 100 days, respectively. The slope of the B light curve is higher that those found by Lair et al. (2006) but lower that those in the V, R and I bands. Despite these differences, these decline rates are consistent with other well studied SNe Ia (e.g., Stanishev et al. 2007; Leloudas et al. 2009), which show the same slower decline in the I band.
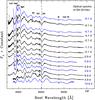 |
Fig. 4 Spectroscopic sequence of SN 2010ev ranging from −6.1 to 19.9 days around B-band maximum. Each spectrum has been corrected for Milky Way reddening and shifted by an arbitrary amount for presentation. We show low resolution spectra in blue and medium resolution spectra in black. The phases are labeled on the right. |
3.2. Color curves
The (B − V), (V − R) and (V − I) color curves of SN 2010ev are compared in Fig. 3 with SN 2002bo (Benetti et al. 2004), SN 2002dj (Pignata et al. 2008), and SN 2002er (Pignata et al. 2004), as well as the delayed-detonation B15 model (gray lines) for SN 2002bo. The colors have been corrected for Milky Way (MW) extinction exclusively. The B15 model colors were obtained with synthetic photometry by integrating the model spectral energy distributions (SEDs).
At maximum, these SNe all are redder in B − V colors than the typical average SN Ia color (B − V ~ 0), as represented by the B15 model. Before maximum, SN 2002bo is redder in (B − V) colors than SN 2010ev, but they are similar in color at around 20 days. Meanwhile, SN 2002dj and SN 2002er are bluer at all phases. The B15 model is bluer in B − V than all SNe at all epochs, indicating the high reddening in the line of sight within the host galaxies of these SNe. This is true when using the H07 template as well.
The peak of the (B − V) color evolution happens around 30 days, compared to around 26 days in the B15 model. This evolution is similar in (V − R) and (V − I). The difference in the time of (B − V) maximum and the color evolution are revealed to be very important for SNe Ia (Burns et al. 2014; Förster et al. 2013). According to Blondin et al. (2015) a shift of five days earlier/later in the (B − V) maximum correspond to a decrease/increase of 0.1 M⊙ of 56Ni synthesized during the explosion. Since these SNe have similar peak bolometric luminosity (see Sect. 4.1), the diversity seen in Fig. 3 could be attributed to only small changes in 56Ni mass, which also affect the temperature and ionization.
3.3. Optical spectral evolution
3.3.1. Early phases
Figure 4 shows the optical spectra evolution of SN 2010ev from −6.1 to 19.9 days. The spectra show that SN 2010ev is a normal SN Ia with very prominent Si iiλ6355 Å absorption. Premaximum spectra exhibit characteristic P-Cygni profiles of Si iiλ4130, λ5972, and λ6355; Ca ii H & K λ3945, and IR triplet λ8579; S ii λ5449 and λ5622 Å. Other lines, such as Mg iiλ4481 Åand some blends caused by Fe ii in the 4500 to 5500 Å range, are clearly visible. Despite contamination from the telluric feature near λ7600, O i λ7774 Å is also detected. The narrow Na i D and Ca ii H & K from the host galaxy and the MW, as well as diffuse interstellar bands (DIBs) at λ5780 and λ6283 Å are also present; these DIBs suggest significant reddening.
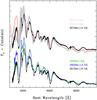 |
Fig. 5 Comparison of premaximum (around −4 days) spectra of SN 2010ev, SN 2002bo, SN 2002dj, the H07 template and B15 model. The spectra have been corrected by MW reddening and redshift. Epochs are indicated in the plot. |
In Fig. 5 the optical spectrum of SN 2010ev at approximately −4 days from B-band maximum is compared at the same epoch with SNe with very prominent Si ii λ6355 Å absorption and similar colors, such as SN 2002bo and SN 2002dj. The H07 template and B15 model are also shown for comparison. As can be seen, SN 2010ev shows stronger Si ii λ6355 absorption features compared with SN 2002bo and SN 2002dj, and similarities in lines like Ca ii and S ii. Since the B15 model is well matched with SN 2002bo, their lines widths and the pseudocontinuum are very similar, while the H07 template shows smaller absorption lines of Si ii λ6355 Å and the Ca ii IR triplet. The O i λ7774 Å line is more prominent in SN 2010ev than the other SNe, which could suggest either differences in the amount of unburned material or in the oxygen abundance, produced by C burning. Considering its velocity (~14 500 km s-1), it could be attributed to unburnt C (Blondin et al. 2015). However, we can not confirm the oxygen abundance using the possible presence of C ii because of a lack of very early spectra.
At maximum, the ratio of the depth of the Si ii λ5972 and λ6355 absorption features, ℛ(Si ii) (Nugent et al. 1995) is ℛ(Si ii) = 0.20 ± 0.03, while the pseudoequivalent widths (pEWs) give 150.80 ± 1.21 Å and 15.91 ± 0.72 Å. Based on the strength of the Si ii lines defined by Branch et al. (2006), SN 2010ev is a broad-line (BL) SN. The evolution of ℛ(Si ii) of SN 2010ev is compared in Fig. 6 with HVG and low velocity gradient (LVG; Benetti et al. 2005) SNe. As can be seen, SN 2010ev shows a dramatic decline before maximum from ℛ(Si ii) = 0.40 at −6 days to ℛ(Si ii) = 0.20 around maximum. Then, it shows a flat evolution, which is consistent with HVG SNe. This behavior reflects lower temperatures before maximum in the spectrum-forming region; these temperatures then increase. Figure 6 also shows the evolution of ℛ(Si ii) for the H07 template and B15 model. The B15 model is consistent with the evolution of the HVG SN 2002bo; meanwhile, the evolution of the H07 template shows a behavior similar to LVG SNe.
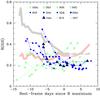 |
Fig. 6 Evolution of ℛ(Si ii) for SN 2010ev compared with a sample of HVG SNe (blue filled symbols) and LVG SNe (empty green symbols). The thick gray line shows the evolution of ℛ(Si ii) for the B15 model and the thick pink line indicates the evolution of ℛ(Si ii for H07 template. |
After maximum, the Ca ii IR triplet (Fig. 4) becomes very prominent, while the Si ii λ5972 and S ii lines fade rapidly. The S ii lines are not detectable ~2 weeks after maximum, whereas Si ii λ6355 is visible for ~20 days. At 14 days after maximum the O i λ7774 line disappears and Ca ii H & K decreases significantly. At around 20 days lines from iron-group elements start to dominate the spectrum, as the SN ejecta layers expand and become more transparent.
3.3.2. Late phases
In the nebular phase, two spectra were obtained at ~177 and ~270 days with FORS2. In this phase, the spectrum is mainly dominated by forbidden lines of iron-group elements: [Fe ii], [Fe iii], [Ni iii], [Ni iii] and [Co ii], which were identified in SN 2010ev (see Fig. 7). The spectra also show typical lines of an H ii region at the SN site, such as Hα, [N ii], and [S ii]. The strongest feature at this epoch is the blend of [Fe iii] lines at λ4701 Å (Maeda et al. 2010b). The velocity offset of peak emission shows a significant temporal change from 1300 ± 100 km s-1 at 177 days to 490 ± 20 km s-1 at 270 days from the rest position. This behavior is consistent with that found by Maeda et al. (2010b) for a sample of 20 SNe Ia with late-time nebular spectra and different velocities, light-curve widths and colors. Meanwhile, the FWHM velocities show the opposite trend: at 177 days, the FWHM = 14 800 ± 300 km s-1 and increases to 16 400 ± 600 km s-1 at 270 days. Taking an average of the relation derived by Mazzali et al. (1998), and more recently by Blondin et al. (2012), we can infer Δm15(B) = 1.10 ± 0.03 based on the FWHM velocities of [Fe iii] at t> 200 d, which is consistent with that obtained with SNooPy. However, it should be noted that this relation is not significant when subluminous events are excluded (Blondin et al. 2012; Silverman et al. 2013).
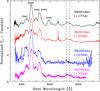 |
Fig. 7 Nebular spectra of SN 2010ev taken at 177 and 270 days compared with SN 2003du, and SN 2002dj around 270 days. The spectra have been corrected for redshift and normalized with respect to the SN 2010ev flux in V band (and shifted by an arbitrary constant).The main features have been labeled, while the epochs and the SN names are shown on the right. The dashed lines are the rest position of [Fe ii] λ7155 and [Ni ii]λ7378. |
Other lines in the spectra seem to have no significant evolution, except the emission lines near ~6000 Å, which appear to decrease with time, and the blend of [Fe ii] λ7155 and [Ni ii]λ7378 features, which develop a double-peaked profile.
In Fig. 7 the nebular spectra of SN 2010ev are compared with SN 2003du (Stanishev et al. 2007) and SN 2002dj (Pignata et al. 2008) at around 270 days. The ~4700 Å feature is similar in SN 2010ev and SN 2002dj, although slightly more pronounced in the latter. In SN 2003du, this feature appears to be stronger. Also, the [Fe ii] λ7155 and [Ni ii]λ7378 lines are blueshifted. This shift may suggest an asymmetry during the initial deflagration of the explosion in the direction away from the observer (Maeda et al. 2010a). At 270 days, we find vneb = 2150 ± 220 km s-1, inferred from the average of the Doppler shifts of the emission lines of [Fe ii]λ7155 and [Ni ii]λ7378. Redshifted nebular velocities have been found to relate to HVG and redder colors (Maeda et al. 2011; Förster et al. 2012) and narrow Na i D equivalent width (Förster et al. 2012). We confirm these trends with SN 2010ev.
3.4. Near-infrared spectral evolution
The NIR spectra of SN 2010ev between −6 to 15 days with respect to Bmax are presented in Fig. 8. The early spectra show a blue pseudocontinuum with a weak feature at ~10 500 Å, which corresponds to Mg ii λ10927 (Wheeler et al. 1998). The strength of this feature seems to be constant with time, while other lines are getting stronger. Near ~16 500 Å a weak feature is clearly visible, that has been identified as Si ii by Gall et al. (2012) and as Fe iii by Hsiao et al. (2013). Near ~20 800 Å we detect a feature which has not been clearly identified, but according to Benetti et al. (2004) this line is due to Si ii, while Stanishev et al. (2007) suggest that the line is Si iii. C i λ10693 is not detected in our spectra, but possibly contributes to Mg ii λ10927.
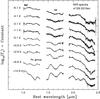 |
Fig. 8 NIR spectra of SN 2010ev taken between ~−7 and ~15 days with X-Shooter. The spectra are shown in log scale. Each spectrum have been corrected for redshift and shifted by an arbitrary amount for presentation. The phases are labeled on the left. |
The H band break ratio (R = f1/f2) defined by Hsiao et al. (2013) as the ratio between the maximum flux level redward of 1.5 μm (f1) and the maximum flux just blueward of 1.5 μm (f2), can be seen in the spectra of SN 2010ev at 2.9 days. The break at this epoch increases from R = 1.26 ± 0.14 to 2.14 ± 0.11 at 6.9 days and takes the maximum value at 14.9 days (R = 3.11 ± 0.09). Hsiao et al. (2013) found that this parameter appears to peak uniformly around 12 days past B-band maximum, and that it is correlated with Δm15(B). Using the mean decline rate estimated by Hsiao et al. (2013) for a sample of SNe Ia, we measure the ratio at 12 days and find R12 = 3.39 ± 0.15, which corresponds well with our Δm15(B) estimate (Hsiao et al. 2013, Fig. 11).
At 6.9 days the spectrum shows emission features present at 15 500 Å and 17 500 Å. These features are attributed to blends of iron goup elements: Co ii, Fe ii and Ni ii (Wheeler et al. 1998; Marion et al. 2003). Above 20 000 Å, lines of Co ii dominate the spectrum (Marion et al. 2009). The presence of these lines means that the spectrum-forming region has receded enough to reach the iron group dominated region.
3.5. Expansion velocities
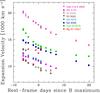 |
Fig. 9 Evolution of expansion velocities of SN 2010ev derived from the maximum absorptions of different lines. |
The analysis of the spectra indicate large and rapidly decreasing expansion velocities as a result of rapidly receding spectrum-forming region to deeper layers with time. In Fig. 9, we present the velocity evolution for selected lines of Si ii, Ca ii, S ii and Mg ii. This figure clearly shows that the expansion velocity of Ca ii is higher than Si ii. The Si ii minimum evolves from 14 800 km s-1 at −7 days to 10 200 km s-1 at 19 days, while at the same epoch Ca ii H & K decrease from 20 100 to 14 000 km s-1 and the Ca ii IR triplet from 17 000 to 11 900 km s-1. This implies that the Ca ii lines mostly form in the outer shell of the ejecta, while S ii, which has a higher ionization potential, forms in deeper layers, resulting in lower absorption velocities (11 400 at −7 days to 8600 km s-1 at 5 days and then disappears). Meanwhile, Mg ii λ10 900 Å shows a nearly constant velocity, which is consistent with the findings of Hsiao et al. (2013), who show that the velocity is remarkably constant after a short period of decline in very early phases. After 1 day past maximum, the Mg ii feature is difficult to measure because of the blend with other lines.
From the velocity evolution of Si iiλ6355 between maximum and 20 days, we obtain a
velocity gradient of  km s-1 d-1, which places SN 2010ev among
the HVG group (Benetti et al. 2005). This result is
comparable with the definitions of velocity gradient put forward by Blondin et al. (2012) and Folatelli et
al. (2013). Following the former authors, we obtain Δvabs/Δt[+0,+10 ] = 166 ± 14 km s-1 d-1, while following the later, we
find Δv20(Si) =
3210 ± 183 km s-1. To be consistent with the units, we divide this last
value by 20 days and we obtain 160.5 ±
9.2 km s-1 d-1. Since the Si ii velocity in SN 2010ev is
quasilinear, all three gradients agree with each other.
km s-1 d-1, which places SN 2010ev among
the HVG group (Benetti et al. 2005). This result is
comparable with the definitions of velocity gradient put forward by Blondin et al. (2012) and Folatelli et
al. (2013). Following the former authors, we obtain Δvabs/Δt[+0,+10 ] = 166 ± 14 km s-1 d-1, while following the later, we
find Δv20(Si) =
3210 ± 183 km s-1. To be consistent with the units, we divide this last
value by 20 days and we obtain 160.5 ±
9.2 km s-1 d-1. Since the Si ii velocity in SN 2010ev is
quasilinear, all three gradients agree with each other.
In Fig. 10 we compare the time evolution of the
expansion velocity of Si iiλ6355 with eight well-studied SNe Ia. It can be
clearly seen that the velocity evolution of SN 2010ev, SN 2002bo, and SN 2002dj are
consistent with the HVG class. In contrast, SN 1994D and SN 2005cf belong to the LVG
group. Table 3 shows the velocity gradient for
these SNe measured in different ways. SN 2010ev has one of the highest
 value. Fig. 10 also shows the velocity evolution for
H07 template and B15 model. As noted above, the B15 model gives better agreement with our
SN, while the H07 template gives better results for the LVG group.
value. Fig. 10 also shows the velocity evolution for
H07 template and B15 model. As noted above, the B15 model gives better agreement with our
SN, while the H07 template gives better results for the LVG group.
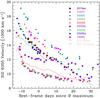 |
Fig. 10 Si iiλ6355 expansion velocity evolution of SN 2010ev derived from the minimum of the absorption line, compared with other SNe: SN 2009Y, SN2006X (Wang et al. 2008; Yamanaka et al. 2009), SN2005cf (Pastorello et al. 2007), SN2004dt (Altavilla et al. 2007), SN2003du (Stanishev et al. 2007), SN2002dj (Pignata et al. 2008), SN2002bo (Benetti et al. 2004), SN1994D (Patat et al. 1996), H07 template, and B15 model. |
Velocity decline for the sample used in Fig. 10. The second column is the mean velocity decline between maximum and +10 days (Blondin et al. 2012). The third column is estimated in the same way but between maximum and 20 days (Folatelli et al. 2013). The last column is derived with a fit between maximum and the last available value (Benetti et al. 2005).
3.6. Extinction from light-curve
The nature of red colors toward SN Ia is still debated. It is not clear what is intrinsic to the SN and what is due to reddening from material in the line of sight. Recent claims of circumstellar interaction have fed the question of whether their color evolution and the atypical inferred host extinction laws actually relate to nearby material ejected close to explosion. In this section we explore different methods to estimate the reddening and extinction law toward SN 2010ev, as well as any other evidence of CSM from a photometric perspective. The B − V color at Bmax obtained from SiFTO is 0.29 ± 0.06. This value is above the typical values of the type Ia SNe that have color at maximum between −0.2 <B − V< 0.2 (e.g. González-Gaitán et al. 2014), so that the host-galaxy extinction appears to be significant from a photometric point of view. With the relation proposed by Phillips et al. (1999), using the maximum-light colors we estimate E(B − V)Host = 0.26 ± 0.07. This result is consistent with the value obtained through the relation of Folatelli et al. (2010): E(B − V)Host = 0.29 ± 0.05 and with E(B − V)Host = 0.29 ± 0.02 given by SNooPy. We summarize these findings in Table 4.
Line-of-sight extinction AV, reddening law RV and color excess E(B − V) for SN 2010ev according to different spectroscopic and photometric techniques.
Extensive evidence (e.g. Riess et al. 1996; Elias-Rosa et al. 2006; Conley et al. 2007; Krisciunas et al. 2007; Goobar et al. 2014) suggests that at least some SNe Ia suffer from a lower characteristic RV reddening law than the Galactic average value of RV = 3.1 (Fitzpatrick & Massa 2007). It has been claimed that such variation could be attributed to CSM near the supernova (Wang 2005; Goobar 2008; Amanullah & Goobar 2011). In fact, there is an intriguing trend of low RVs and high extinction toward SNe (Mandel et al. 2011; Kawabata et al. 2014), which raises the question of whether interstellar extinction toward extragalactic sites with large amounts of dust is different from the Milky Way (MW), or if some nearby material affects the color of SNe Ia in such a way as to mimic this effect. SN 2010ev is reddened and is thus a good candidate for low RV.
To estimate a reddening law for SN 2010ev, we calculate the color excesses at maximum at different wavelengths to fit them to various reddening laws in a similar way as Folatelli et al. (2010). Firstly, we obtain colors (V − X) at B-band maximum light for bands X = u′,B,g′,r′, and i′ obtained from our SiFTO fit. These colors have been K-corrected through the H07 template warped to the observed photometric colors, and then corrected for MW extinction. To obtain color excesses, we use intrinsic colors from both the H07 template and B15 model.
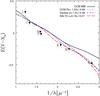 |
Fig. 11 Color excesses E(V − X) vs. 1 /λ for SN 2010ev. Lines are fits to the excesses with a standard Rv = 3.1 (solid black) and free Rv = 1.54 (black dotted) Cardelli et al. (1989) extinction law, a Goobar (2008) law (blue dashed) and a SALT2 color law (Guy et al. 2007) fit (dotted dashed red). |
The resulting color excesses using intrinsic colors from the B15 model are shown in Fig.
11, where we also show different reddening law
fits. The best reddening law we find for Cardelli et al.
(1989), modified by (O’Donnell 1994; CCM)
is Rv = 1.54 ± 0.65 with
E(B −
V) = 0.25 ± 0.05, which is consistent with the model
by Fitzpatrick (1999) (Rv = 1.72 ±
0.60) and is also consistent with the reddening law of Goobar (2008) for circumstellar dust. The reddening law
of SN 2010ev is different from standard values for the MW and is consistent with other
values of reddened SNe. This argues for different dust properties such as size in the CSM
or ISM around the SN, or a combination of normal dust from CSM and ISM (Foley et al. 2014). If we were to use the intrinsic
colors of the H07 template instead, the RV obtained would be
even lower. Such a low RV for SN 2010ev has
also recently been constrained by Burns et al.
(2014) who applied a detailed Baysian analysis to a large sample of SN Ia light
curves. These authors obtained  and
and
 , which yields E(B − V) =
0.32 and is consistent with our approach. One can see that the
u′ band is
crucial to differentiate between different reddening law values. The NIR could help to
constrain these estimates further, however we do not have NIR photometry.
, which yields E(B − V) =
0.32 and is consistent with our approach. One can see that the
u′ band is
crucial to differentiate between different reddening law values. The NIR could help to
constrain these estimates further, however we do not have NIR photometry.
We did similar fits to data at other epochs to investigate the evolution of the reddening law. We do not find any significant change for RV nor E(B − V) between −4 and +15 days from maximum. This argues for no evolution and therefore no nearby dust. We note that for SN 2014J, a highly redenned SN, there is an increase of ~0.4 in RV in the same time range (Foley et al. 2014).
We note that the intrinsic color of SN 2010ev using the observed colors measured by SiFTO and our host reddening estimate is (B − V)int = (B − V) − E(B − V) ≃ 0.06 which is slightly redder than the average intrinsic SN Ia color of (B − V)int ≃ 0. This is consistent with the idea that HVG SNe might be redder both intrinsically and because of host extinction (Foley et al. 2011).
3.7. Narrow absorption features of intervening material
The spectra of SN 2010ev exhibit strong interstellar narrow absorption lines Na i D and Ca ii H & K at the redshift of the host galaxy and the MW, as well as narrow absorption features that correspond to DIBs at the redshift of the host galaxy (λ5780 and λ6283). Typically, DIBs tend to be seen in the spectra of stars (Herbig 1995) or supernovae (e.g. Welty et al. 2014) reddened by interstellar dust, giving further evidence for the strong extinction inferred for SN 2010ev in the previous section. The identification of these lines was made using the diffuse interstellar band catalog3 (Jenniskens & Desert 1994). Figure 12 shows some of these lines and another unknown narrow line complex in the red part of λ6283 Å, which we have not identified.
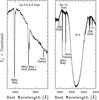 |
Fig. 12 Inset of medium-resolution spectra of SN 2010ev showing characteristic narrow absorption lines from intervening material in the line of sight. |
Temporal evolution of these lines could signify changes in ionization balance induced by the SN radiation field as shown for Na i D (Patat et al. 2007; Blondin et al. 2009; Simon et al. 2009; Sternberg et al. 2014), for K i (Graham et al. 2015) and possibly for DIBs as well (Milisavljevic et al. 2014). We investigate this by analyzing the temporal evolution of the pEW of these lines. We measure them simply by tracing a straight line along the absorption feature to mimic the pseudocontinuum flux, and then estimate the error measuring the pEW many times, changing the trace of the continuum. Using these multiple measurements, we calculate a mean and take the standard deviation to be the error on that measurement. The absorption features of Na i D and Ca ii H & K from the MW and the host galaxy do not seem to evolve with time. Regarding the DIBs, we find no evidence of evolution for λ5780 but a slight decrease for λ6283.
Recent studies of moderate-resolution absorption lines of Na i D have revealed an interesting excess of blueshifted absorptions toward SNe Ia, suggestive of pre-SN outflows (Sternberg et al. 2011; Maguire et al. 2013; Phillips et al. 2013). The SNe that show blueshifted absorption seem to relate to the strength of the Na i D absorption and the color of the SN (Maguire et al. 2013). Having strong absorption features and red colors, one could expect SN 2010ev to present these shifts. However, we do not find any evidence for blueshift in any of our narrow absorption lines (in agreement with Phillips et al. 2013) arguing for a low amount of CSM in this SN, nevertheless, this may also be due to a lack of sufficient spectral resolution to rule out such a feature confidently.
Besides giving us possible information about the CSM interaction, the strength of the line can be a useful diagnostic of the amount of absorption by intervening material in the line of sight. The Na i D doublet has been used in the past as an indicator of the host galaxy extinction (Turatto et al. 2003; Poznanski et al. 2012) although some have questioned the validity of this doublet (Poznanski et al. 2011; Phillips et al. 2013). Using the method introduced by Phillips et al. (2013) with column densities of Na i D, one obtains E(B − V)MW = 0.09 (using RV = 3.1) and E(B − V)Host = 0.25 (using RV = 1.54).
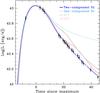 |
Fig. 13 Bolometric light curve of SN 2010ev. Circles denote the optical pseudobolometric light curve, the solid blue line is the two-component fit (see text), the dotted cyan line is the one-component fit (simple model), and the red and gray lines are the pseudobolometric light curves for the H07 template and B15 model normalized to the peak bolometric luminosity of SN 2010ev. |
For the host galaxy, we can additionally use independent constraints on the reddening from the DIBs. Using the relations between the EW of the DIBs and E(B − V) proposed by Luna et al. (2008) for post-AGB stars, we estimate a reddening for λ5780 of E(B − V)Host = 0.53 ± 0.09 and for λ6283 of E(B − V)Host = 0.50 ± 0.04. These values are too large compared with other photometric and spectroscopic estimates, as much as a factor of ~2, as also recently shown by Welty et al. (2014). For the host, there is another narrow line that we can use, K i, with the relation found by Phillips et al. (2013), yielding E(B − V)Host = 0.16 (using RV = 1.54). These results are summarized in Table 4. The color excesses obtained with photometric analysis give consistent results, while the narrow absorption features agree only for the more recent studies of Phillips et al. (2013).
4. Discussion
4.1. Bolometric luminosity and Nickel mass
In this section we calculate the bolometric light curve of SN 2010ev, which is a valuable tool to describe the general properties of the SN and to infer characteristics of the explosion and progenitor. We assume the reddening law of RV = 1.54 for the host, as previously calculated, with an extinction of E(B − V)Host = 0.25. We used a distance of 29.88 ± 8.11 Mpc taken from a mean of several methods from NED. Since we have enough photometric optical coverage but no NIR nor UV photometry, we can obtain a pseudobolometric light curve by integrating all u′Bg′Vr′Ri′I photometry corrected for MW and host extinctions. The pseudobolometric light curve is shown in circles in Fig. 13. Errors are calculated integrating the photometry taking their respective errors into account. We also obtain the bolometric light curve for the H07 template and the B15 model (solid and dashed lines in Fig. 13) from the integration of their SEDs in the same wavelength range covered by the filters.
The bolometric luminosity at maximum is Lbol = (1.54 ± 0.07) × 1043 erg s-1. A simple estimate of the 56Ni mass synthesized during the explosion can be obtained using Arnett’s rule (Arnett 1982). Adopting a rise-time, i.e., the duration from explosion to maximum light, of tr = 16.00 ± 0.21 days given the stretch of the SN (González-Gaitán et al. 2012), we obtain 0.56 ± 0.10 M⊙ of 56Ni.
To model the entire bolometric light curve, we employ a modified version of the approach by Arnett (1982): the work by Maeda et al. (2003) shows that a two-component model is necessary to fit both the optically thick and thin regimes.4 Therefore, in addition to the synthesized 56Ni mass (MNi), the total ejected mass (Mej), and the kinetic energy (Ek), two new physical parameters are invoked: the fraction of mass (fM) and energy (fE) of the inner component. Moreover, in addition to these two physical components, we define two different regimes in the temporal evolution of the luminosity: the optically thick phase (around maximum light) and the optically thin (or nebular) phase. In our modeling procedure, the transition lies at the epoch when the optically thick model does not provide a good fit anymore. Usually, it would overestimate the luminosity 30 to 40 days after the explosion.
The optically thick phase was modeled as if only the outer component was contributing to the total observed luminosity according to Valenti et al. (2008). As suggested by Pignata et al. (2008), we measure the velocity at maximum absorption of S ii λ5460 Å and obtain 5270 ± 110 km s-1. Using SYNOW (Branch et al. 2006), we obtain a range of acceptable velocity matches between ~5000−10 000 km s-1. Thus, we use 7500 ± 2500 km s-1 and model the error with a Monte Carlo simulation.
The final physical parameters we obtain are MNi = 0.51 ± 0.01 M⊙, with t0 = −15.8 ± 0.1 days, and Mej = 1.2 ± 0.5 M⊙. The other parameters are presented in Table 5.
Main bolometric parameters of SN 2010ev.
The nickel mass that we obtain is very standard for a normal stretch s ~ 1 SN Ia. The B15 model has 0.51 M⊙ of synthetized nickel in remarkable agreement with our estimate. This value is very similar to the nickel mass inferred by Stehle et al. (2005) for SN 2002bo. Scalzo et al. (2014a) find a relation between peak MB and MNi. Based on their relations, from our observed extinction-corrected MB, we obtain MNi ~ 0.26 M⊙, which is clearly below our calculation, even if we assume a standard RV = 3.1 host reddening law. This could be because the relations presented in Scalzo et al. (2014a) are for SNe Ia with normal colors and are not suited for HVG SNe Ia.
The ejecta mass we obtain is consistent within the errors with a Chandrasekhar explosion, although a sub-Chandrasekhar event is possible. If this were the case, it would support the idea that a fraction of SNe Ia explodes below the Chandrasekhar mass (Stritzinger et al. 2006; Scalzo et al. 2014b). Using our stretch and the relation of Scalzo et al. (2014a), we obtain Mej ~ 1.24 M⊙.
4.2. Comparison with other SNe and templates
The analysis carried out in the previous sections shows that the properties of SN 2010ev, such as high velocities and their fast gradient, evolution of the ℛ(Si ii), line widths, and overall match with the spectra at different epochs, are in better agreement with the B15 model and HVG SNe. Since the B15 model is a good match to SN 2002bo, an object that is similar to our SN, we expect all of these SN 2002bo-like objects to have similar physical parameters such us density profile, explosion energy, nickel mass and nucleosynthetic yields (see Blondin et al. 2015).
The differences between these two groups of objects (HVG and LVG), best represented by the H07 template and B15 model, could suggest two different explosion mechanisms in normal SNe Ia. On the one hand, the Chandrasekhar mass delayed detonation model can fit the HVG SNe quite well, while, on the other hand, the more common LVG SNe are not well matched and could be explained by alternative models such as pulsational-delayed detonations (Dessart et al. 2014). The colors at maximum and their evolution also differ considerably. However, both groups have similar light-curve widths and only small differences in B-band magnitude. This shows that the diversity of SNe Ia goes beyond a simple parameter related to brightness and light-curve width, and a further degree of complexity gives rise to spectral and color differences.
4.3. Extinction and reddening
It has become clear in recent years that, for some SNe Ia, we infer extremely low RV values (even lower than 2) in the line of sight to their host galaxies that are atypical of the MW. This has been shown for average reddening laws of SN populations (Wang et al. 2009) and for individual SNe (e.g. Burns et al. 2014). SN 2010ev is one of these SNe. The reddening is inferred from photometric and spectroscopic studies. One should not assume a global intrinsic color for all SNe Ia: Here we use the B15 model that is well matched to another similar HVG SN, i.e., SN 2002bo. The unusual reddening laws for SN 2010ev and other SNe are confirmed through other studies, such as Phillips et al. (2013), and also through independent polarimetric analysis (Zelaya et al. 2015; Kawabata et al. 2014. As a matter of fact, Zelaya et al. (2015) measure a continuum polarization for SN 2010ev of (1.67 ± 0.65)%, which is higher than for normal unreddened SNe Ia, and peaks at ≲3500 Å implying an RV ≲ 2 (Hough et al. 1987; Wang et al. 2003; Patat et al. 2009). These SNe with low RV values are redder, they suffer more extinction, and have spectra that present narrow absorption lines and DIBs, which are typically attributed to the same intervening material. This poses the question of whether the deviation from the standard MW reddening law is a common feature of SN host environments. However, a recent study of the reddening of the environment of the redenned SN 2014J (Hutton et al. 2015) shows that the RV values in the vicinity of the SN do not have the atypical value found in the SN data of RV ~ 1.4 (Foley et al. 2014; Amanullah et al. 2014), arguing for an effect of the SN radiation on nearby material. Furthermore, the observation of an excess population of SNe Ia with blueshifted Na i D absorption (Sternberg et al. 2011) has been explained through outflowing nearby material instead of galactic winds (Park et al. 2015), especially since the same excess is not observed for CC SNe. SNe with low RV values are redder at maximum due to extinction but possibly also intrinsically, and they have characteristic ejecta properties that is different from LVG objects. These objects are generally HVG SNe, which show a correlation between their high velocities decline rates at early epochs, and the redshifted nebular velocities at late phases. This relation between intrinsic and extrinsic properties has encouraged the idea that perhaps the material in the line of sight stems from the progenitor itself. Recent searches for light echoes from CSM for a large fraction of SNe Ia in optical spectra (Marino et al. 2015) or NIR photometry (Maeda et al. 2015) defy the CSM light-echo hypothesis. Either another mechanism such as CSM dust sublimation is at hand, or simply low RVs originate from the ISM (perhaps patchy ISM; Förster et al. 2013). Furthermore, the majority of these SNe, with few exceptions, do not show any variation of narrow absorption lines nor of the continuum polarization, which in principle are typical signatures of CSM.
5. Conclusions
We presented an analysis of SN 2010ev spectra and photometry ranging from −7.5 to 289.5 days around the time of B-band maximum. SN 2010ev has a light-curve width typical of normal SN Ia, but with high reddening in the line of sight. The presence of strong Na I D features invariant in time and DIBs located at ~5780 and ~6283 Å suggest a high extinction possibly due to ISM of the host galaxy. The E(B − V) is calculated with different methods and our best estimate is E(B − V)Host = 0.25 ± 0.05 with an RV = 1.54 ± 0.65.
In general, the spectral evolution of SN 2010ev shows similarities to the high velocity
gradient (HVG) group (Benetti et al. 2005) with a
velocity gradient value of km s-1 d-1. Within the classification
presented by Branch et al. (2006), SN 2010ev is
placed in the BL group, which is almost equivalent to HVG. The early-time spectra, both in
the optical and NIR ranges, show characteristic P-Cygni profiles of Si ii,
Ca ii, S ii, Mg ii, and Fe ii. We found no evidence of
either high velocity features (HVFs) or C ii lines, owing to the lack of very
early-time spectra. The nebular spectra show the redshifted [Fe ii] λ7155 and
[Ni ii]λ7378 features, which may suggest an asymmetry during
the explosion (Maeda et al. 2010a). The estimated
nebular velocity vneb
= 2145 ± 225 km s-1 is consistent with that of HVG SNe. The spectral and
photometric evolution is also similar to other HVG SNe Ia such as SN 2002bo and SN 2002dj.
The bolometric analysis provides a nickel mass of 0.51 ± 0.01 M⊙ in agreement with 0.51 M⊙ from the Chandrasekhar delayed-detonation model of Blondin et al. (2015), and an ejected mass of 1.2 ± 0.5 M⊙, which is also consistent with a standard Chandrasekhar mass explosion. This SN is a further member of the group of SNe Ia with normal light-curve decline and standard inferred nickel mass, yet reddened by dust with an unusual low RV. This SN also has high velocity gradient and redshifted nebular velocities. There seems to be a coincidence of intrinsic and extrinsic properties for certain SNe Ia that necessitates an explanation and may be key to understanding the SN Ia progenitor and explosion mechanism.
IRAF is distributed by the National Optical Astronomy Observatories (NOAO), which are operated by the Association of Universities for Research in Astronomy (AURA), Inc., under cooperative agreement with the National Science Foundation.
Synthetic spectra obtained from: https://www-n.oca.eu/supernova/snia/sn2002bo.html
The two-component model was applied to hypernovae by Maeda et al. (2003), however, it is more generally applicable to any event powered predominantly by the decay of 56Ni.
Acknowledgments
We thank the anonymous referee for useful suggestions. C.P.G., S.G., G.P., M.H., F.B. acknowledge support by projects IC120009 “Millennium Institute of Astrophysics (MAS) and P10-064-F “Millennium Center for Supernova Science” of the Iniciativa Científica Milenio del Ministerio Economía, Fomento y Turismo de Chile. S.G. aknowledgeds support by CONICYT through FONDECYT grant 3130680. G.P. acknowledges support by the Proyecto FONDECYT 11090421. M.S. gratefully acknowledges the generous support provided by the Danish Agency for Science and Technology and Innovation realized through a Sapere Aude Level 2 grant. S.T. is supported by the Transregional Collaborative Research Centre TRR 33 “The Dark Universe” of the DFG This research has made use of the NASA/IPAC Extragalactic Database (NED) which is operated by the Jet Propulsion Laboratory, California Institute of Technology, under contract with the National Aeronautics.
References
- Altavilla, G., Stehle, M., Ruiz-Lapuente, P., et al. 2007, A&A, 475, 585 [NASA ADS] [CrossRef] [EDP Sciences] [Google Scholar]
- Amanullah, R., & Goobar, A. 2011, ApJ, 735, 20 [NASA ADS] [CrossRef] [Google Scholar]
- Amanullah, R., Goobar, A., Johansson, J., et al. 2014, ApJ, 788, L21 [NASA ADS] [CrossRef] [Google Scholar]
- Arnett, W. D. 1982, ApJ, 253, 785 [NASA ADS] [CrossRef] [Google Scholar]
- Benetti, S., Meikle, P., Stehle, M., et al. 2004, MNRAS, 348, 261 [NASA ADS] [CrossRef] [Google Scholar]
- Benetti, S., Cappellaro, E., Mazzali, P. A., et al. 2005, ApJ, 623, 1011 [NASA ADS] [CrossRef] [Google Scholar]
- Blondin, S., Prieto, J. L., Patat, F., et al. 2009, ApJ, 693, 207 [NASA ADS] [CrossRef] [Google Scholar]
- Blondin, S., Matheson, T., Kirshner, R. P., et al. 2012, AJ, 143, 126 [NASA ADS] [CrossRef] [Google Scholar]
- Blondin, S., Dessart, L., & Hillier, D. J. 2015, MNRAS, 448, 2766 [Google Scholar]
- Branch, D., Dang, L. C., Hall, N., et al. 2006, PASP, 118, 560 [NASA ADS] [CrossRef] [Google Scholar]
- Branch, D., Dang, L. C., & Baron, E. 2009, PASP, 121, 238 [NASA ADS] [CrossRef] [Google Scholar]
- Burns, C. R., Stritzinger, M., Phillips, M. M., et al. 2011, AJ, 141, 19 [NASA ADS] [CrossRef] [Google Scholar]
- Burns, C. R., Stritzinger, M., Phillips, M. M., et al. 2014, ApJ, 789, 32 [NASA ADS] [CrossRef] [Google Scholar]
- Cardelli, J. A., Clayton, G. C., & Mathis, J. S. 1989, ApJ, 345, 245 [NASA ADS] [CrossRef] [Google Scholar]
- Conley, A., Carlberg, R. G., Guy, J., et al. 2007, ApJ, 664, L13 [NASA ADS] [CrossRef] [Google Scholar]
- Conley, A., Sullivan, M., Hsiao, E. Y., et al. 2008, ApJ, 681, 482 [NASA ADS] [CrossRef] [Google Scholar]
- Dessart, L., Blondin, S., Hillier, D. J., & Khokhlov, A. 2014, MNRAS, 441, 532 [NASA ADS] [CrossRef] [Google Scholar]
- Elias-Rosa, N., Benetti, S., Cappellaro, E., et al. 2006, MNRAS, 369, 1880 [NASA ADS] [CrossRef] [Google Scholar]
- Fitzpatrick, E. L. 1999, PASP, 111, 63 [NASA ADS] [CrossRef] [Google Scholar]
- Fitzpatrick, E. L., & Massa, D. 2007, ApJ, 663, 320 [NASA ADS] [CrossRef] [EDP Sciences] [Google Scholar]
- Folatelli, G., Phillips, M. M., Burns, C. R., et al. 2010, AJ, 139, 120 [NASA ADS] [CrossRef] [Google Scholar]
- Folatelli, G., Morrell, N., Phillips, M. M., et al. 2013, ApJ, 773, 53 [NASA ADS] [CrossRef] [Google Scholar]
- Foley, R. J., Sanders, N. E., & Kirshner, R. P. 2011, ApJ, 742, 89 [NASA ADS] [CrossRef] [Google Scholar]
- Foley, R. J., Fox, O. D., Mc Mulley, C., et al. 2014, MNRAS, 443, 2887 [NASA ADS] [CrossRef] [Google Scholar]
- Förster, F., González-Gaitán, S., Anderson, J., et al. 2012, ApJ, 754, L21 [NASA ADS] [CrossRef] [Google Scholar]
- Förster, F., González-Gaitán, S., Folatelli, G., & Morrell, N. 2013, ApJ, 772, 19 [NASA ADS] [CrossRef] [Google Scholar]
- Gall, E. E. E., Taubenberger, S., Kromer, M., et al. 2012, MNRAS, 427, 994 [NASA ADS] [CrossRef] [Google Scholar]
- González-Gaitán, S., Conley, A., Bianco, F. B., et al. 2012, ApJ, 745, 44 [NASA ADS] [CrossRef] [Google Scholar]
- González-Gaitán, S., Hsiao, E. Y., Pignata, G., et al. 2014, ApJ, 795, 142 [NASA ADS] [CrossRef] [Google Scholar]
- Goobar, A. 2008, ApJ, 686, L103 [NASA ADS] [CrossRef] [Google Scholar]
- Goobar, A., Johansson, J., Amanullah, R., et al. 2014, ApJ, 784, L12 [NASA ADS] [CrossRef] [Google Scholar]
- Graham, M. L., Valenti, S., Fulton, B. J., et al. 2015, ApJ, 801, 136 [NASA ADS] [CrossRef] [Google Scholar]
- Guy, J., Astier, P., Baumont, S., et al. 2007, A&A, 466, 11 [NASA ADS] [CrossRef] [EDP Sciences] [Google Scholar]
- Hamuy, M., Phillips, M. M., Suntzeff, N. B., et al. 1996, AJ, 112, 2438 [NASA ADS] [CrossRef] [Google Scholar]
- Herbig, G. H. 1995, ARA&A, 33, 19 [NASA ADS] [CrossRef] [Google Scholar]
- Hough, J. H., Bailey, J. A., Rouse, M. F., & Whittet, D. C. B. 1987, MNRAS, 227, 1P [NASA ADS] [CrossRef] [Google Scholar]
- Hoyle, F., & Fowler, W. A. 1960, ApJ, 132, 565 [NASA ADS] [CrossRef] [EDP Sciences] [Google Scholar]
- Hsiao, E. Y., Conley, A., Howell, D. A., et al. 2007, ApJ, 663, 1187 [NASA ADS] [CrossRef] [Google Scholar]
- Hsiao, E. Y., Marion, G. H., Phillips, M. M., et al. 2013, ApJ, 766, 72 [NASA ADS] [CrossRef] [Google Scholar]
- Hutton, S., Ferreras, I., & Yershov, V. 2015, MNRAS, 452, 1412 [NASA ADS] [CrossRef] [Google Scholar]
- Iben, Jr., I., & Tutukov, A. V. 1984, ApJS, 54, 335 [NASA ADS] [CrossRef] [Google Scholar]
- Jenniskens, P., & Desert, F.-X. 1994, A&AS, 106, 39 [NASA ADS] [Google Scholar]
- Kawabata, K. S., Akitaya, H., Yamanaka, M., et al. 2014, ApJ, 795, L4 [NASA ADS] [CrossRef] [Google Scholar]
- Krisciunas, K., Garnavich, P. M., Stanishev, V., et al. 2007, AJ, 133, 58 [NASA ADS] [CrossRef] [Google Scholar]
- Kromer, M., Sim, S. A., Fink, M., et al. 2010, ApJ, 719, 1067 [NASA ADS] [CrossRef] [Google Scholar]
- Lair, J. C., Leising, M. D., Milne, P. A., & Williams, G. G. 2006, AJ, 132, 2024 [NASA ADS] [CrossRef] [Google Scholar]
- Landolt, A. U. 1992, AJ, 104, 372 [NASA ADS] [CrossRef] [Google Scholar]
- Landolt, A. U. 2007, AJ, 133, 2502 [NASA ADS] [CrossRef] [Google Scholar]
- Leloudas, G., Stritzinger, M. D., Sollerman, J., et al. 2009, A&A, 505, 265 [NASA ADS] [CrossRef] [EDP Sciences] [Google Scholar]
- Luna, R., Cox, N. L. J., Satorre, M. A., et al. 2008, A&A, 480, 133 [NASA ADS] [CrossRef] [EDP Sciences] [MathSciNet] [Google Scholar]
- Maeda, K., Mazzali, P. A., Deng, J., et al. 2003, ApJ, 593, 931 [NASA ADS] [CrossRef] [Google Scholar]
- Maeda, K., Benetti, S., Stritzinger, M., et al. 2010a, Nature, 466, 82 [NASA ADS] [CrossRef] [PubMed] [Google Scholar]
- Maeda, K., Taubenberger, S., Sollerman, J., et al. 2010b, ApJ, 708, 1703 [NASA ADS] [CrossRef] [Google Scholar]
- Maeda, K., Leloudas, G., Taubenberger, S., et al. 2011, MNRAS, 413, 3075 [NASA ADS] [CrossRef] [Google Scholar]
- Maeda, K., Nozawa, T., Nagao, T., & Motohara, K. 2015, MNRAS, 452, 3281 [NASA ADS] [CrossRef] [Google Scholar]
- Maguire, K., Sullivan, M., Patat, F., et al. 2013, MNRAS, 436, 222 [NASA ADS] [CrossRef] [Google Scholar]
- Mandel, K. S., Narayan, G., & Kirshner, R. P. 2011, ApJ, 731, 120 [NASA ADS] [CrossRef] [Google Scholar]
- Marion, G. H., Höflich, P., Vacca, W. D., & Wheeler, J. C. 2003, ApJ, 591, 316 [NASA ADS] [CrossRef] [Google Scholar]
- Marion, G. H., Höflich, P., Gerardy, C. L., et al. 2009, AJ, 138, 727 [NASA ADS] [CrossRef] [Google Scholar]
- Marino, S., González-Gaitán, S., Förster, F., et al. 2015, ApJ, 806, 134 [NASA ADS] [CrossRef] [Google Scholar]
- Mazzali, P. A., Cappellaro, E., Danziger, I. J., Turatto, M., & Benetti, S. 1998, ApJ, 499, L49 [NASA ADS] [CrossRef] [Google Scholar]
- Milisavljevic, D., Margutti, R., Crabtree, K. N., et al. 2014, ApJ, 782, L5 [NASA ADS] [CrossRef] [Google Scholar]
- Modigliani, A., Goldoni, P., Royer, F., et al. 2010, in SPIE Conf. Ser., 7737 [Google Scholar]
- Nomoto, K. 1982, ApJ, 253, 798 [NASA ADS] [CrossRef] [Google Scholar]
- Nugent, P., Phillips, M., Baron, E., Branch, D., & Hauschildt, P. 1995, ApJ, 455, L147 [NASA ADS] [CrossRef] [Google Scholar]
- O’Donnell, J. E. 1994, ApJ, 437, 262 [NASA ADS] [CrossRef] [Google Scholar]
- Pakmor, R., Kromer, M., Taubenberger, S., et al. 2012, ApJ, 747, L10 [Google Scholar]
- Park, J., Jeong, H., & Yi, S. K. 2015, ApJ, 809, 91 [NASA ADS] [CrossRef] [Google Scholar]
- Pastorello, A., Taubenberger, S., Elias-Rosa, N., et al. 2007, MNRAS, 376, 1301 [NASA ADS] [CrossRef] [Google Scholar]
- Patat, F., Benetti, S., Cappellaro, E., et al. 1996, MNRAS, 278, 111 [NASA ADS] [CrossRef] [Google Scholar]
- Patat, F., Chandra, P., Chevalier, R., et al. 2007, Science, 317, 924 [NASA ADS] [CrossRef] [EDP Sciences] [PubMed] [Google Scholar]
- Patat, F., Baade, D., Höflich, P., et al. 2009, A&A, 508, 229 [NASA ADS] [CrossRef] [EDP Sciences] [Google Scholar]
- Phillips, M. M. 1993, ApJ, 413, L105 [NASA ADS] [CrossRef] [Google Scholar]
- Phillips, M. M., Lira, P., Suntzeff, N. B., et al. 1999, AJ, 118, 1766 [NASA ADS] [CrossRef] [Google Scholar]
- Phillips, M. M., Simon, J. D., Morrell, N., et al. 2013, ApJ, 779, 38 [NASA ADS] [CrossRef] [Google Scholar]
- Pignata, G., Patat, F., Benetti, S., et al. 2004, MNRAS, 355, 178 [NASA ADS] [CrossRef] [Google Scholar]
- Pignata, G., Benetti, S., Mazzali, P. A., et al. 2008, MNRAS, 388, 971 [NASA ADS] [CrossRef] [Google Scholar]
- Pignata, G., Cifuentes, M., Maza, J., et al. 2010, Central Bureau Electronic Telegrams, 2344, 1 [NASA ADS] [Google Scholar]
- Poznanski, D., Ganeshalingam, M., Silverman, J. M., & Filippenko, A. V. 2011, MNRAS, 415, L81 [NASA ADS] [CrossRef] [Google Scholar]
- Poznanski, D., Prochaska, J. X., & Bloom, J. S. 2012, MNRAS, 426, 1465 [NASA ADS] [CrossRef] [Google Scholar]
- Raskin, C., Timmes, F. X., Scannapieco, E., Diehl, S., & Fryer, C. 2009, MNRAS, 399, L156 [NASA ADS] [CrossRef] [Google Scholar]
- Raskin, C., Kasen, D., Moll, R., Schwab, J., & Woosley, S. 2014, ApJ, 788, 75 [NASA ADS] [CrossRef] [Google Scholar]
- Riess, A. G., Press, W. H., & Kirshner, R. P. 1996, ApJ, 473, 588 [NASA ADS] [CrossRef] [Google Scholar]
- Scalzo, R., Aldering, G., Antilogus, P., et al. 2014a, MNRAS, 440, 1498 [NASA ADS] [CrossRef] [Google Scholar]
- Scalzo, R. A., Ruiter, A. J., & Sim, S. A. 2014b, MNRAS, 445, 2535 [Google Scholar]
- Schlafly, E. F., & Finkbeiner, D. P. 2011, ApJ, 737, 103 [NASA ADS] [CrossRef] [Google Scholar]
- Schlegel, D. J., Finkbeiner, D. P., & Davis, M. 1998, ApJ, 500, 525 [NASA ADS] [CrossRef] [Google Scholar]
- Shen, K. J., Guillochon, J., & Foley, R. J. 2013, ApJ, 770, L35 [NASA ADS] [CrossRef] [Google Scholar]
- Silverman, J. M., & Filippenko, A. V. 2012, MNRAS, 425, 1917 [NASA ADS] [CrossRef] [Google Scholar]
- Silverman, J. M., Kong, J. J., & Filippenko, A. V. 2012, MNRAS, 425, 1819 [NASA ADS] [CrossRef] [Google Scholar]
- Silverman, J. M., Ganeshalingam, M., & Filippenko, A. V. 2013, MNRAS, 430, 1030 [NASA ADS] [CrossRef] [Google Scholar]
- Sim, S. A., Fink, M., Kromer, M., et al. 2012, MNRAS, 420, 3003 [NASA ADS] [CrossRef] [Google Scholar]
- Simon, J. D., Gal-Yam, A., Gnat, O., et al. 2009, ApJ, 702, 1157 [NASA ADS] [CrossRef] [Google Scholar]
- Smith, J. A., Tucker, D. L., Kent, S., et al. 2002, AJ, 123, 2121 [Google Scholar]
- Stanishev, V., Goobar, A., Benetti, S., et al. 2007, A&A, 469, 645 [NASA ADS] [CrossRef] [EDP Sciences] [Google Scholar]
- Stehle, M., Mazzali, P. A., Benetti, S., & Hillebrandt, W. 2005, MNRAS, 360, 1231 [NASA ADS] [CrossRef] [Google Scholar]
- Sternberg, A., Gal-Yam, A., Simon, J. D., et al. 2011, Science, 333, 856 [NASA ADS] [CrossRef] [Google Scholar]
- Sternberg, A., Gal Yam, A., Simon, J. D., et al. 2014, MNRAS, 443, 1849 [NASA ADS] [CrossRef] [Google Scholar]
- Stritzinger, M. 2010, Central Bureau Electronic Telegrams, 2346, 1 [NASA ADS] [Google Scholar]
- Stritzinger, M., Leibundgut, B., Walch, S., & Contardo, G. 2006, A&A, 450, 241 [NASA ADS] [CrossRef] [EDP Sciences] [Google Scholar]
- Tripp, R. 1998, A&A, 331, 815 [NASA ADS] [Google Scholar]
- Turatto, M., Benetti, S., & Cappellaro, E. 2003, in From Twilight to Highlight: The Physics of Supernovae, eds. W. Hillebrandt, & B. Leibundgut (Heidelberg: ESO Springer Series), 200 [Google Scholar]
- Valenti, S., Benetti, S., Cappellaro, E., et al. 2008, MNRAS, 383, 1485 [NASA ADS] [CrossRef] [Google Scholar]
- Wang, L. 2005, ApJ, 635, L33 [NASA ADS] [CrossRef] [Google Scholar]
- Wang, L., Baade, D., Höflich, P., et al. 2003, ApJ, 591, 1110 [NASA ADS] [CrossRef] [Google Scholar]
- Wang, X., Baade, D., Höflich, P., et al. 2008, AJ, 626, 1 [Google Scholar]
- Wang, X., Filippenko, A. V., Ganeshalingam, M., et al. 2009, ApJ, 699, L139 [NASA ADS] [CrossRef] [Google Scholar]
- Webbink, R. F. 1984, ApJ, 277, 355 [NASA ADS] [CrossRef] [Google Scholar]
- Welty, D. E., Ritchey, A. M., Dahlstrom, J. A., & York, D. G. 2014, ApJ, 792, 106 [NASA ADS] [CrossRef] [EDP Sciences] [Google Scholar]
- Wheeler, J. C., Hoeflich, P., Harkness, R. P., & Spyromilio, J. 1998, ApJ, 496, 908 [NASA ADS] [CrossRef] [Google Scholar]
- Yamanaka, M., Naito, H., Kinugasa, K., et al. 2009, PASJ, 61, 713 [NASA ADS] [Google Scholar]
Appendix A: Photometric tables
BVRI and u′g′r′i′z′ magnitudes of the local photometric standard stars in the field of SN 2010ev (Fig. 1), obtained with PROMPT1, PROMPT3, and PROMPT5.
BVRI and Sloan photometry of SN 2010ev with PROMPT1, PROMPT3 and PROMPT5 telescopes.
All Tables
Velocity decline for the sample used in Fig. 10. The second column is the mean velocity decline between maximum and +10 days (Blondin et al. 2012). The third column is estimated in the same way but between maximum and 20 days (Folatelli et al. 2013). The last column is derived with a fit between maximum and the last available value (Benetti et al. 2005).
Line-of-sight extinction AV, reddening law RV and color excess E(B − V) for SN 2010ev according to different spectroscopic and photometric techniques.
BVRI and u′g′r′i′z′ magnitudes of the local photometric standard stars in the field of SN 2010ev (Fig. 1), obtained with PROMPT1, PROMPT3, and PROMPT5.
BVRI and Sloan photometry of SN 2010ev with PROMPT1, PROMPT3 and PROMPT5 telescopes.
All Figures
|
Fig. 1 Finding chart showing the position of SN 2010ev and that of the local sequence stars used for photometric calibration. The image was taken with PROMPT1 and covers an area of about 8′× 7′. The crosshair indicates the position of the supernova. |
| In the text | |
|
Fig. 2 BVRI and u′g′r′i′z′ light curves of SN 2010ev. The SNooPy fits are shown with solid lines while the SiFTO fits are shown with dotted lines. The light curves have been shifted by the amount shown in the label. |
| In the text | |
|
Fig. 3 Color evolution of SN 2010ev compared with high velocity gradient (HVG) SNe Ia: SN 2002bo, SN 2002dj, and SN 2002er. The SN colors have been dereddened for MW extinction only. We also show the colors of the B15 model without extinction (solid gray line) and with the host extinction (dashed gray line) obtained in Sect. 3.6. |
| In the text | |
|
Fig. 4 Spectroscopic sequence of SN 2010ev ranging from −6.1 to 19.9 days around B-band maximum. Each spectrum has been corrected for Milky Way reddening and shifted by an arbitrary amount for presentation. We show low resolution spectra in blue and medium resolution spectra in black. The phases are labeled on the right. |
| In the text | |
|
Fig. 5 Comparison of premaximum (around −4 days) spectra of SN 2010ev, SN 2002bo, SN 2002dj, the H07 template and B15 model. The spectra have been corrected by MW reddening and redshift. Epochs are indicated in the plot. |
| In the text | |
|
Fig. 6 Evolution of ℛ(Si ii) for SN 2010ev compared with a sample of HVG SNe (blue filled symbols) and LVG SNe (empty green symbols). The thick gray line shows the evolution of ℛ(Si ii) for the B15 model and the thick pink line indicates the evolution of ℛ(Si ii for H07 template. |
| In the text | |
|
Fig. 7 Nebular spectra of SN 2010ev taken at 177 and 270 days compared with SN 2003du, and SN 2002dj around 270 days. The spectra have been corrected for redshift and normalized with respect to the SN 2010ev flux in V band (and shifted by an arbitrary constant).The main features have been labeled, while the epochs and the SN names are shown on the right. The dashed lines are the rest position of [Fe ii] λ7155 and [Ni ii]λ7378. |
| In the text | |
|
Fig. 8 NIR spectra of SN 2010ev taken between ~−7 and ~15 days with X-Shooter. The spectra are shown in log scale. Each spectrum have been corrected for redshift and shifted by an arbitrary amount for presentation. The phases are labeled on the left. |
| In the text | |
|
Fig. 9 Evolution of expansion velocities of SN 2010ev derived from the maximum absorptions of different lines. |
| In the text | |
|
Fig. 10 Si iiλ6355 expansion velocity evolution of SN 2010ev derived from the minimum of the absorption line, compared with other SNe: SN 2009Y, SN2006X (Wang et al. 2008; Yamanaka et al. 2009), SN2005cf (Pastorello et al. 2007), SN2004dt (Altavilla et al. 2007), SN2003du (Stanishev et al. 2007), SN2002dj (Pignata et al. 2008), SN2002bo (Benetti et al. 2004), SN1994D (Patat et al. 1996), H07 template, and B15 model. |
| In the text | |
|
Fig. 11 Color excesses E(V − X) vs. 1 /λ for SN 2010ev. Lines are fits to the excesses with a standard Rv = 3.1 (solid black) and free Rv = 1.54 (black dotted) Cardelli et al. (1989) extinction law, a Goobar (2008) law (blue dashed) and a SALT2 color law (Guy et al. 2007) fit (dotted dashed red). |
| In the text | |
|
Fig. 12 Inset of medium-resolution spectra of SN 2010ev showing characteristic narrow absorption lines from intervening material in the line of sight. |
| In the text | |
|
Fig. 13 Bolometric light curve of SN 2010ev. Circles denote the optical pseudobolometric light curve, the solid blue line is the two-component fit (see text), the dotted cyan line is the one-component fit (simple model), and the red and gray lines are the pseudobolometric light curves for the H07 template and B15 model normalized to the peak bolometric luminosity of SN 2010ev. |
| In the text | |
Current usage metrics show cumulative count of Article Views (full-text article views including HTML views, PDF and ePub downloads, according to the available data) and Abstracts Views on Vision4Press platform.
Data correspond to usage on the plateform after 2015. The current usage metrics is available 48-96 hours after online publication and is updated daily on week days.
Initial download of the metrics may take a while.