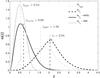
Fig. 5

Left: expected normalized distributions ω as a function of the redshift of the lensed sources (zs) and of the deflectors (zd). For comparison, we also include the normalized redshift distribution of the sources (ωQSO). The simulations were made assuming θmin = 0.2′′. We indicate the median value of each distribution (![]() ,
, ![]() and
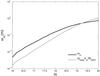
and ![]() ). Right: normalized distribution
). Right: normalized distribution ![]() of the lensed sources as a function of the apparent magnitude. For comparison, we show the DNCF as a function of the magnitude of all the detected sources, normalized by NQSO/ ΩGaia.
of the lensed sources as a function of the apparent magnitude. For comparison, we show the DNCF as a function of the magnitude of all the detected sources, normalized by NQSO/ ΩGaia.
Current usage metrics show cumulative count of Article Views (full-text article views including HTML views, PDF and ePub downloads, according to the available data) and Abstracts Views on Vision4Press platform.
Data correspond to usage on the plateform after 2015. The current usage metrics is available 48-96 hours after online publication and is updated daily on week days.
Initial download of the metrics may take a while.