| Issue |
A&A
Volume 589, May 2016
|
|
|---|---|---|
| Article Number | A51 | |
| Number of page(s) | 7 | |
| Section | Interstellar and circumstellar matter | |
| DOI | https://doi.org/10.1051/0004-6361/201527962 | |
| Published online | 12 April 2016 | |
The environment of the γ-ray emitting SNR G338.3−0.0: a hadronic interpretation for HESS J1640−465
Instituto de Astronomía y Física del Espacio (IAFE,
CONICET−UBA) CC 67, Suc. 28,
1428
Buenos Aires,
Argentina
e-mail: This email address is being protected from spambots. You need JavaScript enabled to view it.
Received:
14
December
2015
Accepted:
24
February
2016
Abstract
The supernova remnant (SNR) G338.3−0.0 spatially correlates with HESS J1640−465, which is considered the most luminous γ-ray source associated with a SNR in our Galaxy. The X-ray pulsar PSR J1640−4631 has been recently discovered within the SNR shell, which could favor a leptonic origin for the detected very-high-energy (VHE) emission. In spite of this, the origin of the VHE radiation from HESS J1640−465 has not been unambiguously clarified so far. Indeed, a hadronic explanation cannot be ruled out by current observations. On the basis of atomic (HI) and molecular (12CO) archival data, we determine, for the first time, the total ambient density of protons in the region of the G338.3−0.0/HESS J1640−465 system, a critical parameter for understanding the emission mechanisms at very high energies. The value obtained is in the 100−130 cm-3 range. Besides this, we developed a new hadronic model to describe the spectral energy distribution (SED) of the HESS J1640−465 source, which includes the latest total γ-ray cross-section for proton-proton collisions available in the literature. By using the assessed ambient proton density, we found that the total energy in accelerated protons required to fit the data is 5.4+4.7-2.3 ×1049 erg and 1.6+1.4-0.7 ×1050 erg for a source distance of 8.5 and 13 kpc, respectively. The case where the source distance is 8.5 kpc agrees with the typical scenario in which the energy released is on the order of 1051 erg and ~10% of that energy is transferred to the accelerated protons, whereas the case corresponding to a source distance of 13 kpc requires either a higher value of the energy released in the explosion or a larger energy fraction to accelerate protons.
Key words: ISM: supernova remnants / ISM: individual objects: SNR G338.3-0.0 / gamma rays: ISM
© ESO, 2016
1. Introduction
HESS J1640−465 is considered the most luminous very-high-energy (VHE) γ-ray source associated with a Galactic supernova remnant (SNR). Since its discovery, it has been linked to the SNR G338.3−0.0 because in the plane of the sky they appear spatially coincident (Aharonian et al. 2005). At TeV energies HESS J1640−465 has been reported to be marginally extended with a Gaussian radius of 4.́3 (Abramowski et al. 2014b), although the last statistical update on this source shows a more extended emission with a size of ~12′ (see Fig. 1 in Abramowski et al. 2014a).
At radio wavelengths the remnant G338.3−0.0 shows two bright arcs comprising an incomplete shell of ~8′ in size, whose northern part is seen projected at the edge of a confusing area with several HII regions (Castelletti et al. 2011). Recently, on the basis of NuSTAR observations the previously known X-ray source XMMU J164045.4−463131 inside the radio shell of G338.3−0.0, was confirmed as a pulsar named PSR J1640−4631 (Gotthelf et al. 2014 and references therein).
Roughly a decade after the discovery of HESS J1640−465 (Aharonian et al. 2005), its origin is still an open question. Moreover, although the study of the medium in which G338.3−0.0 evolves is crucial for understanding the origin of the VHE radiation, it has never been investigated in detail, and in particular, there is no observational determination of the ambient density reported to date. In this work we analyze the environment of the SNR G338.3−0.0 through a multiwavelength approach, and we use the observational data to establish, for the first time, constraints on the ambient proton density. Additionally, we investigate the plausibility of a hadronic mechanism for the γ-ray emission by modeling the GeV−TeV spectrum with the latest estimations available in the literature of the cross section for γ-ray production through proton-proton interactions.
2. The data
We analyzed the surroundings of G338.3−0.0 by using observations of both the atomic and the molecular gas. The neutral hydrogen (HI) data were extracted from the Southern Galactic Plane Survey (SGPS I, McClure-Griffiths et al. 2005), which combines low- and high-resolution data from observations in the HI 21-cm line carried out with the 64-m single-dish Parkes telescope and the interferometer ATCA. The SGPS dataset has an angular resolution of 2.́2 and a separation between consecutive velocity channels of 0.82 km s-1. Radial velocities for this survey, as well as the ones used throughout this work, are measured with respect to the local standard of rest (LSR). The rms sensitivity of the HI survey is ~1.6 K. On the other hand, the molecular gas distribution was traced by using the emission corresponding to the J = 1−0 rotational transition at 115 GHz of the 12CO. These data were acquired with the 1.2-m telescope at the Cerro Tololo Inter-American Observatory in Chile, and they provide an angular resolution and a velocity channel separation of 0.̊125 and 1.30 km s-1, respectively, with an rms noise per velocity channel of ~0.12 K (Dame et al. 2001).
To trace the detailed radio continuum emission of G338.3−0.0 and its surroundings we used the image at 610 MHz presented in Castelletti et al. (2011). It was obtained from observations carried out with the Giant Metrewave Radio Telescope (GMRT) and has a synthesized beam of 12.̋6 × 5.̋0 and an rms noise level of 1.6 mJy beam-1.
An image of the region around G338.3−0.0 emitting at 870 μm was extracted from the APEXTelescope Large Area Survey of the Galaxy (ATLASGAL), carried out with the LABOCA bolometer array at the APEX telescope (Schuller et al. 2009). The angular resolution of the ATLASGAL image is ~19.̋2, and the typical rms noise is ~50−70 mJy beam-1.
Additionally to the spectral line and continuum radio observations, three representative wavelengths were selected to reveal the far-infrared (far-IR) emission at 24, 160, and 250 μm. The map at the lowest wavelength was obtained from the 24 and 70 Micron Survey of the Inner Galactic Disk with MIPS (MIPSGAL, Carey et al. 2009), carried out with the MIPS camera of Spitzer. The data at 160 and 250 μm acquired with the PACS (Poglitsch et al. 2010) and SPIRE (Griffin et al. 2010) instruments aboard Herschel1, respectively, were retrieved from the Herschel Science Archive (HSA).
3. Results
3.1. Observational constraints for the ISM around the SNR G338.3−0.0
Much of the discussion in the following depends on the radio continuum and γ-ray emission extents in the field toward G338.3−0.0. Therefore, before presenting our analysis of the medium in the vicinity of this remnant, we display in Fig. 1 the GMRT high-resolution image at 610 MHz obtained in direction to G338.3−0.0 overlaid with a few representative contours from the updated H.E.S.S. image of HESS J1640−465 presented in Abramowski et al. (2014a). The bright region that appears to be in contact with the northern side of the SNR shell corresponds to the complex of thermal HII regions (Urquhart et al. 2012, Brown et al. 2014), whose names are also labeled in Fig. 1 for reference.
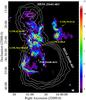 |
Fig. 1 Field-of-view of G338.3−0.0 as seen by the GMRT at 610 MHz with an angular resolution of 12.̋6 × 5.̋0 and a sensitivity of 1.6 mJy beam-1 (Castelletti et al. 2011). The linear scale is in units of mJy beam-1. White contours delineate the VHE emission from HESS J1640−465 with significance levels of 5, 6, 7, and 8σ (Abramowski et al. 2014a). The point spread function of the H.E.S.S. data is 0.̊085 (68% containment region). The white cross indicates the position of PSR J1640−4631. The three HII regions whose distance is reported by Urquhart et al. (2012) and the bubble G338.364+00.020 are also indicated. |
A parameter of particular interest for determining the characteristics of the environment in which a SNR evolves is its distance. On the basis of HI 21-cm absorption and emission spectra, Lemiere et al. (2009) put G338.3−0.0 at distances between 8.5 and 13 kpc, the same range that we adopt in our calculations. Although the connection between G338.3−0.0 and the group of the northern HII regions has not been unambiguously proved, the general consistency of the SNR HI absorption spectrum with that obtained toward the ionized gas seems to support that they are physically related (Lemiere et al. 2009). This may convey the idea that G338.3−0.0 is evolving in an inhomogeneous density environment. Based on HI absorption profiles, Urquhart et al. (2012) established a distance of ~13 kpc for the HII regions G338.39+0.16, G338.4+00.0, and G338.45+0.06 in the complex (see Fig. 1).
We study the interstellar medium (ISM) in the region of G338.3−0.0 based on observations of the HI and 12CO line intensities. Figure 2 provides an overview of the atomic hydrogen emission integrated in the velocity intervals that correspond to the lower and upper kinematical distance limits to the SNR. Each image is the result of an integration in 16 consecutive spectral channels, spanning 13 km s-1 around the central velocity corresponding to distance values of 8.5 and 13 kpc (assuming the rotation curve for our Galaxy of Fich et al. 1989, with R0 = 8.5 kpc and Θ0 = 220 km s-1). One can see that the HI gas depicts an inhomogeneous distribution, with remarkable minima exactly overlapping both the shell of G338.3−0.0 and the ionized gas extending to the north. The remaining velocity images in the HI data cube show no features that may be clearly associated with G338.3−0.0.
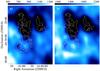 |
Fig. 2 HI emission toward G338.3−0.0 and the adjacent HII region complex, integrated in the velocity range a) from −121 to −111 km s-1 and b) from −40 to −25 km s-1. The scales are linear in K km s-1. White contours delineate the radio emission at 610 MHz from Fig. 1 at levels of 43 and 65 mJy beam-1. |
Even though the lack of sufficient angular resolution of the 12CO data prevents us from clearly distinguishing small-scale spatial correspondences between the shock front of G338.3−0.0 and the molecular content in the region, we can still search for some kinematical evidence by analyzing the spectral properties of the interstellar gas. We thus construct combined spectra of the 12CO emission and HI absorption in the direction of the radio-bright east and west limbs of the SNR. Both spectra are presented in Fig. 3. The absorption profiles of the atomic gas, drawn by a red line in Fig. 3, were obtained after subtracting an average background spectrum to the emission one. Several molecular components, represented by the blue line in both panels of Fig. 3, are also apparent in the velocity distribution of the 12CO. Using the Fich et al. (1989) rotation curve, we found that the components at the highest negative velocities from ~−125 to ~−107 km s-1 (peak centered at ~−116 km s-1) and those in the velocity range between ~−40 and ~−23 km s-1 (peak centered at ~−31 km s-1), respectively, include the lower and upper limits set on the SNR distance. In fact, owing to the kinematic distance ambiguity (KDA) in the fourth quadrant of the Galaxy, the peak centered at ~−116 km s-1 corresponds to a distance of either 6.5 or 9.3 kpc, whereas near and far distances of 2.6 and 13.2 kpc are deduced for the latter one centered at ~−31 km s-1. To resolve the distance ambiguity, we note that in both spectra obtained toward the east and west rims, the 12CO emission centered at ~−116 km s-1 is associated with an absorption line in the HI 21-cm spectra up to the velocity of the tangent point. The 12CO emission seen around this velocity may, therefore, be the result of molecular material located beyond the tangent point, which is approximately ~8 kpc. In this case, the corresponding HI absorption feature could be attributed to the atomic gas embedded within the 12CO, which absorbs the continuum from G338.3−0.0. In addition, spectral asymmetries toward red- and blueshifted velocities are evident at the highest negative velocity range for each SNR boundary. Numerous factors can contribute to the observed broadening, among them perturbations in the velocity field of the molecular material caused by the interaction with the SNR shock front, thus providing an argument for the connection between the molecular emission and G338.3−0.0. On the other hand, for both rims in G338.3−0.0, we consider the spectral match between the molecular emission line at ~−31 km s-1 and possible absorption HI features somewhat speculative, and therefore it is difficult to reach any conclusion on the location of this molecular material. However, as discussed below, the spatial correlation between the radio and the submillimeter continuum emission, and the sites emitting in the IR band, supports the hypothesis that these spectral features most probably reveal interstellar material in the surroundings of the SNR.
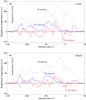 |
Fig. 3 a)12CO emission spectrum (blue line) and HI emission and absorption spectra (dashed black and red line, respectively) obtained in direction to the bright eastern rim of the G338.3−0.0. b) The same as in a), toward the western rim of the remnant, where the source AGAL338.307+00.006 is located. |
Supplementary evidence of the inhomogeneous medium that surrounds G338.3−0.0 can be obtained from submillimeter and far-IR continuum emission across the field. Figure 4a shows the 870 μm continuum emission as observed by APEX. In the middle part of the western radio-bright shell of G338.3−0.0, as seen in projection, there is a conspicuous bright clump (RA =  , Dec =
  , J2000.0) embedded in a diffuse emission region extending (~2′) to the south. The angular extent of the clump, cataloged as the ATLASGAL source AGAL338.307+00.006 (CSC2Contreras et al. 2013), is about 80′′. Panels b, c, and d in Fig. 4, respectively, display the far-IR emission at 24 μm from Spitzer, and in the two Herschel bands of 160 and 250 μm. These images show that most of the long-wavelength IR emission is inside the intensity green contour that delineates the supernova shock front. Among the most remarkable IR features are the bubble G338.364+00.020 lying in the north side of the remnant (Anderson et al. 2014) and the bright knot located in the western rim, likely the IR counterpart of the identified submillimeter clump. Additionally, a trail of diffuse IR emission is seen matching the western limb of G338.3−0.0. On the whole, the inhomogeneities observed from the atomic and molecular gas are thus supported by the morphological properties observed in the far-IR emission, which could arise from the interstellar dust embedded in the molecular material shocked and heated by the passage of the SNR shock front. Besides this, it is probable that the clump emitting at 870 μm corresponds to dense material within the molecular gas.
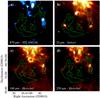 |
Fig. 4 a) 870-μm view of G338.3−0.0 taken from the ATLASGAL. The source AGAL338.307+00.006 is outlined by white contours. From b) to d): far-IR emission in the field of G338.3−0.0 at 24 μm from Spitzer, and at 160 and 250 μm from Herschel, respectively. The 4.3 mJy beam-1 green contour level from the 610 MHz image is included on each panel to facilitate the comparison between the submillimeter and IR emission with total power radio features. |
3.2. The proton content in the SNR surroundings
In Fig. 5 we present the distribution of the column density of the molecular and atomic protons in the region of G338.3−0.0 for the velocity width Δv = 13 km s-1 overlapping the velocities corresponding to the lower and upper kinematical distance determinations to G338.3−0.0. The superposed contours of the radio continuum emission at 610 MHz are plotted for reference. A gradient in the column density, hence in the distribution of the ISM, from the southeastern half of the field to the northwestern region dominates the picture.
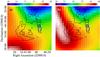 |
Fig. 5 Total proton column density distribution toward G338.3−0.0, in the same velocity ranges as in Fig. 2: a) from −121 to −111 km s-1 and b) from −40 to −25 km s-1. The scale is in units of 1021 cm-2. This image was obtained by summing up the proton contributions to the total column density from the atomic and molecular species of hydrogen. The resolution is the same as the 12CO data. Black contours delineate the radio emission at 610 MHz at the same levels as in Fig. 2. Blue contours indicate the source AGAL338.307+00.006. |
For each interval of radial velocities Δν considered in this work (see Fig. 2), the hydrogen column density NHI was determined using the relation (Dickey & Lockman 1990)  (1)which assumes that the emission is optically thin with a brightness temperature of the atomic gas emission represented by Tb.
An almost circular geometry defined by a mean radius of 0.̊12 was assumed for the zone in which we integrate the HI emission, according to the updated extension of HESS J1640−465 (Abramowski et al. 2014a). On the other hand, the proton contribution from the molecular hydrogen integrated in the same area was estimated through the column density of the molecular hydrogen NH2. It was inferred from the 12CO dataset, through the integrated 12CO emission  , using the 12CO-to-H2 conversion factor XCO = NH2/W12CO = 2.0 × 1020 cm-2 (K km s-1)-1 reported by Bertsch et al. (1993). The total proton column density is therefore obtained taking both the atomic and molecular contributions into account: Np = NHI + 2NH2. For the highest velocity range, the integration from −121 to −111 km s-1 yields a total column density Np ~ 6.6 × 1021 cm-2, while for the interval between −40 and −25 km s-1, the column is Np ~ 8.7 × 1021 cm-2. In both cases the main contribution to Np is given by the molecular hydrogen. We then use the derived column density to roughly calculate the average proton density
  for the TeV region, where we assume that the thickness L along the line of sight equals the size of the minor axis of the integration region (L ~ 36 pc and L ~ 55 pc at distances of 8.5 and 13 kpc, respectively). The total proton density estimated in this way varies between 100 and 130 cm-3 for the upper and lower distance limits, respectively, with uncertainties of about 30%. The associated total proton masses are approximately 2 × 10⁵ and 4 × 10⁴M⊙ for each density value.
Additionally, we infer the mass and density of the gas in the bright clump identified at submillimeter wavelengths, using the relation given by Abreu-Vicente et al. (2015) for ATLASGAL sources  (2)where ν represents a frequency of 345 GHz (corresponding to 870 μm) at which an integrated flux density Sν is measured over the source, d is the distance to the clump, and Bν(Td) is the Planck distribution function at the dust temperature Td, assumed to be ~20 K (Schuller et al. 2009). Here, R is the gas-to-dust ratio, and κν is the dust absorption coefficient. If we adopt canonical values of 100 and 1.85 cm2 g-1 for R and κν (Schuller et al. 2009) and use the flux density measurement for AGAL338.307+00.006 reported in the CSC catalog Sν = (8.48 ± 1.55) Jy (which corresponds to a region with an effective radius of about 40′′), we obtain a total mass of ~4.2 × 10³M⊙. In this calculation we assume an average distance of ~10 kpc to the clump. The hydrogen particle density of the clump can be calculated through the relation (Rosolowsky et al. 2010)
  (3)where r is the radius of the ATLASGAL source, while μH = 2.8 and mH are the mean particle mass and the hydrogen atom mass, respectively. The resulting density is ~2.5 × 103 cm-3. Both the mass and density obtained here for AGAL338.307+00.006 are comparable to those found in other ATLASGAL sources with similar characteristics to the clump analyzed here (Schuller et al. 2009).
4. γ-ray production in the SNR G338.3-0.0/HESS J1640-465 system
4.1. Background on γ-ray emission models
To put the calculations presented in this work in context, we first briefly review the models that over the past eight years have been proposed to account for the spectral energy distribution (SED) of the G338.3−0.0/HESS J1640−465 system. At the beginning, the detection of the source XMMU J164045.4−463131 (Funk et al. 2007), which was by then a promising pulsar candidate inside the radio extent of G338.3−0.0, made the pure leptonic processes the most natural way to explain the observed TeV γ rays. Indeed, a variety of leptonic models have been elaborated, in which the γ-ray photons are primarily created via inverse Compton (IC) interactions of energetic electrons injected by the compact source that scatter with ambient photons (Lemiere et al. 2009; Slane et al. 2010).
Later on to model the flux measurements from radio to the γ-ray band, Abramowski et al. (2014b) included the contribution to the TeV photons resulting from interactions of electrons accelerated at the SNR shock front with their surroundings. However, as noted by the authors themselves, their approach with fixed IC contribution from the dust content and electron/proton ratio fails in providing a good fit to the γ-ray spectral shape. A possible contribution by electron bremsstrahlung emission was also considered by Abramowski et al. (2014b) to explain the origin of HESS J1640−465, but they found that a high target density of 500 cm-3 and high electron/proton ratios of about 0.1 are needed to match the TeV fluxes of the source.
On the basis of the physical parameters derived for the recently discovered pulsar PSR J1640−4631 within the SNR G338.3−0.0, Gotthelf et al. (2014) revised an evolutionary model for the pulsar wind nebula (PWN) in which the broad-band spectrum for HESS J1640−465 is fit with a single power-law function. With a pulsar distance assumed to be 12 kpc, Gotthelf et al. (2014) find a fitted low ambient density of 0.03 cm-3. It is interesting to point out that in all the aforementioned leptonic models, the radio band is poorly sampled. Indeed, except in the Abramowski et al. (2014b) work, in which the radio flux estimates at 235, 610, 1280, and 2300 MHz (Castelletti et al. 2011) were arbitrarily scaled (by a factor of 0.5), in the remaining works only the flux upper limit determined at 610 MHz (Giacani et al. 2008) or the flux at 843 MHz (Whiteoak & Green 1996) were considered to anchor the spectrum of HESS J1640−465 at the lower energy end.
Different hadronic models were also applied to account for the spectral distribution of HESS J1640−465. For the hadronic emission, the observed γ rays would be generated in the decay of neutral pions created after the collisions of protons accelerated at the SNR shock with dense interstellar material. However, in all the works that analyze this alternative scenario, no observational constraints on the surrounding medium density were used, but this relevant magnitude was either derived from the fitted γ-ray spectrum or constrained during the modeling. For instance, low ambient densities of ~1 cm-3, for distances less than 8 kpc, and the SN total energy required to accelerate hadrons as large as ~7.6 × 1050 erg were deduced in the model proposed by Funk et al. (2007). On the other hand, Slane et al. (2010) find that hadronic modeling is possible with an assumed shock compression ratio of 4 and a high total SN energy transferred to accelerated protons of 25%, which fix the ISM density at ~100 cm-3.
Similar values for the ambient density were deduced by Abramowski et al. (2014b). However, they determined that the product of total proton energy and mean target density could be as high as  erg cm-3, assuming a distance of 10 kpc to G338.3−0.0. A more recent estimation of the high-energy part of the HESS J1640−465 SED has been reported in Lemoine-Goumard et al. (2014), using the latest Fermi-LAT data. In that work a harder SED compared with earlier studies was obtained. These authors also developed a hadronic model to explain both the high- and very-high-energy part of the SED by using the new Fermi-LAT fluxes. Based on the previous considerations from Abramowski et al. (2014b), they used an ambient proton density of 150 cm-3 and concluded that a hadronic scenario is a viable option. However, they found difficulties in discarding a component originated in the PWN, which could relax the constrain of high values of energy in accelerated protons that require the hadronic scenario in some regions of the parameter space.
In the following, we show that the GeV−TeV γ-ray spectrum of HESS J1640−465, which incorporates the latest data collected with the Fermi-LAT and H.E.S.S. instruments, can be explained on the basis of the pure hadronic model developed in the current work. Our new analysis uses target proton densities measured in the region of the γ-ray source to conciliate the difficulties of earlier models by bringing together reasonable values for the SN explosion energy and the efficiency of converting this energy into shock accelerated protons.
4.2. An improved hadronic model
As already discussed in Sect. 4.1, a hadronic origin of the γ-ray emission from HESS J1640−465 has been previously proposed in the literature. In this section we present a new model to account for the production of γ rays in the HESS source via hadronic interactions. As an important particularity, our emission model uses the parametrization of the γ-ray differential cross section in the proton-proton collisions given in Kafexhiu et al. (2014), which is more detailed and comprehensive than previously published ones (Kelner et al. 2006; Kamae et al. 2006). Consequently, the differential cross-section, especially in the low proton energy part, together with the fit of the spectral index and the cutoff energy (which are fixed a priori in previous models) are now described much better. In modeling the spectra, we consider the latest statistics data from Fermi-LAT and H.E.S.S. of HESS J1640−465. The total energy going into accelerated protons required for fitting all the collected data points, which is an essential physical parameter to test the feasibility of the model, is assessed by using the proton density in the region of the γ-ray emission obtained in Sect. 3.1,  cm-3. It is worth mentioning that the relevance of this magnitude in our model was the main motivation of a reliable determination of the ambient protons density in the region of the source.
We fit the γ-ray data points by assuming a proton distribution in momentum given by a power law with an exponential cutoff  (4)where C is a normalization constant; p the momentum of the accelerated protons, which is related to the proton energy by
 ![Mathematical equation: \hbox{$E_{\rm p}=\sqrt{\smash[b]{c^2 p^2 + m_{\rm p}^2 c^4}}$}](/articles/aa/full_html/2016/05/aa27962-15/aa27962-15-eq78.png) (c is the speed of light and mp the proton mass), Γ is the spectral index, and pcut represents the cutoff momentum. The cutoff proton energy is given by
(c is the speed of light and mp the proton mass), Γ is the spectral index, and pcut represents the cutoff momentum. The cutoff proton energy is given by ![Mathematical equation: \hbox{$E_\mathrm{cut}=\sqrt{\smash[b]{{c^2} p^2_\mathrm{cut} + m_{\rm p}^2 c^4}}$}](/articles/aa/full_html/2016/05/aa27962-15/aa27962-15-eq83.png) .
.
The γ-ray flux at Earth can be written as  (5)where d is the distance to the source and dσ/ dEγ is the differential cross-section in proton-proton collisions resulting in the γ-ray emission. The weighted proton density in the region of the source is given by
  (6)where V is the volume of the source, Pp(x) the spatial distribution function of the accelerated protons, and np the total ambient density. It should be noted that for the case where the accelerated protons are uniformly distributed in the source volume Pp(x) = 1 /V, so
  is the average of the proton density in the source volume. We assume that for all subsequent calculations.
The energy spectrum of γ rays originated in proton-proton interactions has been extensively studied in the literature. Recently, a detailed study has been performed by Kafexhiu et al. (2014). In that work, a parametrization of the γ-ray energy spectrum has been obtained for proton energies ranging from the proton-proton kinematic threshold to 1 PeV. The differential cross section at low proton energies (≲ 3 GeV) is obtained from a compilation of experimental data, while at high proton energies it is derived from Monte Carlo simulations. The hadronic interactions at the highest energies are not known. In particular, it is not possible yet to predict the results of these interactions from first principles quantum chromodynamics (see for instance, Werner 1993). Nevertheless, there are models that make use of low energy accelerator data to extrapolate the hadronic interactions to higher energies (d’Enterria et al. 2011). The parametrization in Kafexhiu et al. (2014) has been performed for the hadronic interaction models implemented in Geant 4.10.0 (Agostinelli et al. 2003), PYTHIA 8.18 (Sjöstrand et al. 2008), Sibyll 2.1 (Fletcher et al. 1994), and QGSJET01 (Kalmykov et al. 1997). In this paper, we use the PYTHIA 8.18 option for the high-energy part. It is worth mentioning that one of the most important aspects of the new parametrization is the detailed description of the γ-ray spectrum at low proton energies, which represents an important improvement over older approaches.
In Fig. 6 we show the SED of HESS J1640−465 for high- and very-high energies. The data points of the high-energy part of the SED correspond to observations carried out by Fermi-LAT (Lemoine-Goumard et al. 2014), whereas the measurements are from H.E.S.S. in the VHE region (Abramowski et al. 2014b). We performed a χ2-fitting to all the γ-ray points. The solid line included in Fig. 6 denotes our fit, obtained by using the Eqs. (4) and (5) presented here and leaving C, Γ, and Ecut as free parameters. Our fit provides a spectral index Γ = 2.13 ± 0.02 and a cutoff energy log(Ecut/GeV) = 4.73 ± 0.09.
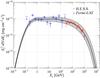 |
Fig. 6 Spectral energy distribution of HESS J1640−465 in the γ-ray band. The squares correspond to Fermi-LAT data, while filled circles correspond to H.E.S.S. observations. The solid line is a χ2 fit of the SED, and the shaded area is the 1σ region of that fit. |
From Fig. 6 it can be seen that the γ-ray spectral shape is quite well fitted by our model, with a χ2 = 38.1 for 28 d.o.f. As mentioned above, it is mandatory to calculate the total energy in accelerated protons required by the model to fit the data points, in order to test the feasibility of it. The total energy in accelerated protons is given by  (7)where it is assumed that Emin = 1.218 GeV, which is the threshold energy for pion production (Kafexhiu et al. 2014). In this way the minimum energy in accelerated protons is calculated, i.e., accelerated protons with lower energies could exist but they cannot produce pions when interacting with ambient protons, and then they do not contribute to the γ-ray spectrum.
For the case in which HESS J1640−465 is placed at the lower distance limit of 8.5 kpc, the value determined for the SNR G338.3−0.0, the total energy in accelerated protons is calculated by using Eq. (7) taking into account the uncertainty on the ambient proton density and on the flux at 1σ level (see shaded region in Fig. 6)  (8)in this expression the central value is obtained by using the best fit to the γ-ray spectral data points and a proton density
  cm-3. On the other hand, for the upper limit of 13 kpc, we obtain the following energy range
  (9)where the central value is obtained by using the best fit to the γ-ray spectrum and a density
  cm-3.
cm-3.
The typical energy released in a SN explosion is assumed to be on the order of 1051 erg, and the canonical fraction of energy transferred to the accelerated particles is 10%. In the case where the source is placed at d = 8.5 kpc, the total energy in accelerated protons is ≲ 1050 erg, which is consistent with the typical scenario. However, when the source is placed at d = 13 kpc, the total energy in accelerated protons can be as high as ~3 × 1050 erg, which is three times greater than the typical value. We note that ℰp ~ 1050 erg is the lower end of the interval. In any case, higher values for the total energy in accelerated protons could be due to either more energy being released in the supernova explosion or a larger amount of energy transferred to this component. Another possibility is the existence of an additional contribution to the γ-ray spectrum because of the PWN in G338.3−0.0 as suggested by Lemoine-Goumard et al. (2014).
As mentioned in Sect. 3.2, the source AGAL338.307+00.006 can be a prominent region of γ-ray emission due to its high value of proton density compared with the average one. The fraction of the total γ-ray flux coming from this region can be estimated through  (10)where
  and Vclump are the average density and volume of AGAL338.307+00.006, while and V are the average density and volume of the entire γ-ray source, respectively. The fraction of the flux for a distance d = 8.5 kpc is fclump ≅ 1.6%, which was obtained using that
  cm-3 (calculated from Eq. (3)) and cm-3. The corresponding value of this fraction for d = 13 kpc is fclump ≅ 1.2%, computed with
  cm-3 (also from Eq. (3)) and cm-3. The volume of both regions depends on the source distance. The cataloged angular size is used to calculate the volume of AGAL338.307+00.006. For the source HESS J1640−465, we use the volume corresponding to the calculation of the average density (see Sec. 3.2). In any case, it seems that the AGAL338.307+00.006 region makes a subdominant contribution to the total γ-ray emission of the source.
5. Summary
In this paper, based on a multiwavelength approach, we have analyzed the morphological and spectral properties of the ISM in the vicinity of the SNR G338.3−0.0. Taking the spatial match between the γ-ray source HESS J1640−465 and the entire shell of the remnant into account, we revisited the likelihood of a hadronic nature for the TeV photons. For this purpose, we analyzed the HI, 12CO, sub-mm continuum, and far-IR available information and showed that this remnant evolves in a highly inhomogeneous ambient with strong gradients in the distribution of the atomic and molecular gas. We have also found possible observational signatures of a physical relationship between the SNR and the 12CO material. Additionally, for the first time, we used the atomic and molecular observational lines to determine the averaged ISM proton density in the 100−130 cm-3 range over the whole extension of HESS J1640−465 (and hence the SNR shell).
Our findings, obtained directly from observational data in the region of the SNR G338.3−0.0/HESS J1640−465 system rather than from the fitting models as occurred in all the previous studies provide support to show that the γ-ray emissivity can be suitably modeled by a purely hadronic scenario. Moreover, the assessed target proton density allowed us to study the feasibility of our model by comparing the energy in accelerated protons, required to fit the γ-ray HESS J1640−465 spectrum, with the typical scenario in which the energy released by the SN explosion is on the order of 1051 erg, and approximately 10% of the shock kinetic energy goes to the relativistic particles. For the case where the system is at a distance of 8.5 kpc, the energy in accelerated protons is consistent with the typical scenario, but when the source is at a distance of 13 kpc, the energy in accelerated protons can be larger (up to a factor of three). The latter case can be explained by the higher energy released during the SN explosion or even by a larger energy fraction transferred to the accelerated protons. In either case, a contribution from the PWN associated with the pulsar PSR J1640−4631 cannot be discarded by the present data. The next generation of Cherenkov telescopes like the Cherenkov Telescope Array (CTA, Actis et al. 2011) will have a much better angular resolution, which will be very useful for identifying the regions where most of γ rays originate. This is of crucial importance for studying the relative contributions of the PWN as well as G338.3−0.0 and surrounding regions.
It is worth mentioning that the average proton density estimated in our work should not have a strong impact on the hadronic models found in the literature (like the one in Abramowski et al. 2014b) because the proton density required or assumed in most of these models is ~150 cm-3, a value contained in the interval of densities obtained in our work for a source distance of 8.5 kpc.
Herschel is an ESA space observatory with science instruments provided by European-led Principal Investigator consortia and with important participation from NASA.
CSC refers to the ATLASGAL – compact source catalog.
Acknowledgments
The authors acknowledge the anonymous referee’s comments that helped to improve the article. A. D. Supanitsky and G. Castelletti are members of the Carrera del Investigador Científico of CONICET, Argentina. L. Supan is a Ph.D. Fellow of CONICET, Argentina. This research was supported by CONICET (Argentina) through the Grant PIP 360/11 and by ANPCyT (Argentina) through the Grants PICT 902/13 and 0571/11. This research has made use of the NASA/IPAC Infrared Science Archive, which is operated by the Jet Propulsion Laboratory, California Institute of Technology, under contract with the National Aeronautics and Space Administration. The ATLASGAL project is a collaboration between the Max-Planck-Gesellschaft, the European Southern Observatory (ESO) and the Universidad de Chile. It includes projects E-181.C-0885, E-078.F-9040(A), M-079.C-9501(A), M-081.C-9501(A), plus Chilean data.
References
- Abramowski, A., Aharonian, F., Ait Benkhali, F., et al. 2014a, ApJ, 794, L1 [NASA ADS] [CrossRef] [Google Scholar]
- Abramowski, A., Aharonian, F., Benkhali, F. A., et al. 2014b, MNRAS, 439, 2828 [NASA ADS] [CrossRef] [Google Scholar]
- Abreu-Vicente, J., Kainulainen, J., Stutz, A., Henning, T., & Beuther, H. 2015, A&A, 581, A74 [NASA ADS] [CrossRef] [EDP Sciences] [Google Scholar]
- Actis, M., Agnetta, G., Aharonian, F., et al. 2011, Exp. Astron., 32, 193 [NASA ADS] [CrossRef] [Google Scholar]
- Agostinelli, S., Allison, J., Amako, K., et al. 2003, Nucl. Instr. Meth. Phys. Res. A, 506, 250 [Google Scholar]
- Aharonian, F., Akhperjanian, A. G., Aye, K.-M., et al. 2005, Science, 307, 1938 [NASA ADS] [CrossRef] [PubMed] [Google Scholar]
- Anderson, L. D., Bania, T. M., Balser, D. S., et al. 2014, ApJS, 212, 1 [NASA ADS] [CrossRef] [Google Scholar]
- Bertsch, D. L., Dame, T. M., Fichtel, C. E., et al. 1993, ApJ, 416, 587 [NASA ADS] [CrossRef] [Google Scholar]
- Brown, C., Dickey, J. M., Dawson, J. R., & McClure-Griffiths, N. M. 2014, ApJS, 211, 29 [NASA ADS] [CrossRef] [Google Scholar]
- Carey, S. J., Noriega-Crespo, A., Mizuno, D. R., et al. 2009, PASP, 121, 76 [NASA ADS] [CrossRef] [Google Scholar]
- Castelletti, G., Giacani, E., Dubner, G., et al. 2011, A&A, 536, A98 [NASA ADS] [CrossRef] [EDP Sciences] [Google Scholar]
- Contreras, Y., Schuller, F., Urquhart, J. S., et al. 2013, A&A, 549, A45 [NASA ADS] [CrossRef] [EDP Sciences] [Google Scholar]
- Dame, T. M., Hartmann, D., & Thaddeus, P. 2001, ApJ, 547, 792 [NASA ADS] [CrossRef] [Google Scholar]
- d’Enterria, D., Engel, R., Pierog, T., Ostapchenko, S., & Werner, K. 2011, Astropart. Phys., 35, 98 [NASA ADS] [CrossRef] [Google Scholar]
- Dickey, J. M., & Lockman, F. J. 1990, ARA&A, 28, 215 [NASA ADS] [CrossRef] [MathSciNet] [Google Scholar]
- Fich, M., Blitz, L., & Stark, A. A. 1989, ApJ, 342, 272 [NASA ADS] [CrossRef] [Google Scholar]
- Fletcher, R. S., Gaisser, T. K., Lipari, P., & Stanev, T. 1994, Phys. Rev. D, 50, 5710 [NASA ADS] [CrossRef] [Google Scholar]
- Funk, S., Hinton, J. A., Pühlhofer, G., et al. 2007, ApJ, 662, 517 [NASA ADS] [CrossRef] [Google Scholar]
- Giacani, E., Castelletti, G., Dubner, G., et al. 2008, in AIP Conf. Ser. 1085, eds. F. A. Aharonian, W. Hofmann, & F. Rieger, 234 [Google Scholar]
- Gotthelf, E. V., Tomsick, J. A., Halpern, J. P., et al. 2014, ApJ, 788, 155 [NASA ADS] [CrossRef] [Google Scholar]
- Griffin, M. J., Abergel, A., Abreu, A., et al. 2010, A&A, 518, L3 [Google Scholar]
- Kafexhiu, E., Aharonian, F., Taylor, A. M., & Vila, G. S. 2014, Phys. Rev. D, 90, 123014 [NASA ADS] [CrossRef] [Google Scholar]
- Kalmykov, N. N., Ostapchenko, S. S., & Pavlov, A. I. 1997, Nucl. Phys. B Proc. Suppl., 52, 17 [Google Scholar]
- Kamae, T., Karlsson, N., Mizuno, T., Abe, T., & Koi, T. 2006, ApJ, 647, 692 [NASA ADS] [CrossRef] [Google Scholar]
- Kelner, S. R., Aharonian, F. A., & Bugayov, V. V. 2006, Phys. Rev. D, 74, 034018 [NASA ADS] [CrossRef] [Google Scholar]
- Lemiere, A., Slane, P., Gaensler, B. M., & Murray, S. 2009, ApJ, 706, 1269 [NASA ADS] [CrossRef] [Google Scholar]
- Lemoine-Goumard, M., Grondin, M.-H., Acero, F., et al. 2014, ApJ, 794, L16 [NASA ADS] [CrossRef] [Google Scholar]
- McClure-Griffiths, N. M., Dickey, J. M., Gaensler, B. M., et al. 2005, ApJS, 158, 178 [NASA ADS] [CrossRef] [Google Scholar]
- Poglitsch, A., Waelkens, C., Geis, N., et al. 2010, A&A, 518, L2 [NASA ADS] [CrossRef] [EDP Sciences] [Google Scholar]
- Rosolowsky, E., Dunham, M. K., Ginsburg, A., et al. 2010, ApJS, 188, 123 [NASA ADS] [CrossRef] [Google Scholar]
- Schuller, F., Menten, K. M., Contreras, Y., et al. 2009, A&A, 504, 415 [NASA ADS] [CrossRef] [EDP Sciences] [Google Scholar]
- Sjöstrand, T., Mrenna, S., & Skands, P. 2008, Comput. Phys. Commun., 178, 852 [Google Scholar]
- Slane, P., Castro, D., Funk, S., et al. 2010, ApJ, 720, 266 [NASA ADS] [CrossRef] [Google Scholar]
- Urquhart, J. S., Hoare, M. G., Lumsden, S. L., et al. 2012, MNRAS, 420, 1656 [NASA ADS] [CrossRef] [Google Scholar]
- Werner, K. 1993, Phys. Rep., 232, 87 [NASA ADS] [CrossRef] [Google Scholar]
- Whiteoak, J. B. Z., & Green, A. J. 1996, A&AS, 118, 329 [NASA ADS] [CrossRef] [EDP Sciences] [Google Scholar]
All Figures
|
Fig. 1 Field-of-view of G338.3−0.0 as seen by the GMRT at 610 MHz with an angular resolution of 12.̋6 × 5.̋0 and a sensitivity of 1.6 mJy beam-1 (Castelletti et al. 2011). The linear scale is in units of mJy beam-1. White contours delineate the VHE emission from HESS J1640−465 with significance levels of 5, 6, 7, and 8σ (Abramowski et al. 2014a). The point spread function of the H.E.S.S. data is 0.̊085 (68% containment region). The white cross indicates the position of PSR J1640−4631. The three HII regions whose distance is reported by Urquhart et al. (2012) and the bubble G338.364+00.020 are also indicated. |
| In the text | |
|
Fig. 2 HI emission toward G338.3−0.0 and the adjacent HII region complex, integrated in the velocity range a) from −121 to −111 km s-1 and b) from −40 to −25 km s-1. The scales are linear in K km s-1. White contours delineate the radio emission at 610 MHz from Fig. 1 at levels of 43 and 65 mJy beam-1. |
| In the text | |
|
Fig. 3 a)12CO emission spectrum (blue line) and HI emission and absorption spectra (dashed black and red line, respectively) obtained in direction to the bright eastern rim of the G338.3−0.0. b) The same as in a), toward the western rim of the remnant, where the source AGAL338.307+00.006 is located. |
| In the text | |
|
Fig. 4 a) 870-μm view of G338.3−0.0 taken from the ATLASGAL. The source AGAL338.307+00.006 is outlined by white contours. From b) to d): far-IR emission in the field of G338.3−0.0 at 24 μm from Spitzer, and at 160 and 250 μm from Herschel, respectively. The 4.3 mJy beam-1 green contour level from the 610 MHz image is included on each panel to facilitate the comparison between the submillimeter and IR emission with total power radio features. |
| In the text | |
|
Fig. 5 Total proton column density distribution toward G338.3−0.0, in the same velocity ranges as in Fig. 2: a) from −121 to −111 km s-1 and b) from −40 to −25 km s-1. The scale is in units of 1021 cm-2. This image was obtained by summing up the proton contributions to the total column density from the atomic and molecular species of hydrogen. The resolution is the same as the 12CO data. Black contours delineate the radio emission at 610 MHz at the same levels as in Fig. 2. Blue contours indicate the source AGAL338.307+00.006. |
| In the text | |
|
Fig. 6 Spectral energy distribution of HESS J1640−465 in the γ-ray band. The squares correspond to Fermi-LAT data, while filled circles correspond to H.E.S.S. observations. The solid line is a χ2 fit of the SED, and the shaded area is the 1σ region of that fit. |
| In the text | |
Current usage metrics show cumulative count of Article Views (full-text article views including HTML views, PDF and ePub downloads, according to the available data) and Abstracts Views on Vision4Press platform.
Data correspond to usage on the plateform after 2015. The current usage metrics is available 48-96 hours after online publication and is updated daily on week days.
Initial download of the metrics may take a while.