Fig. 5
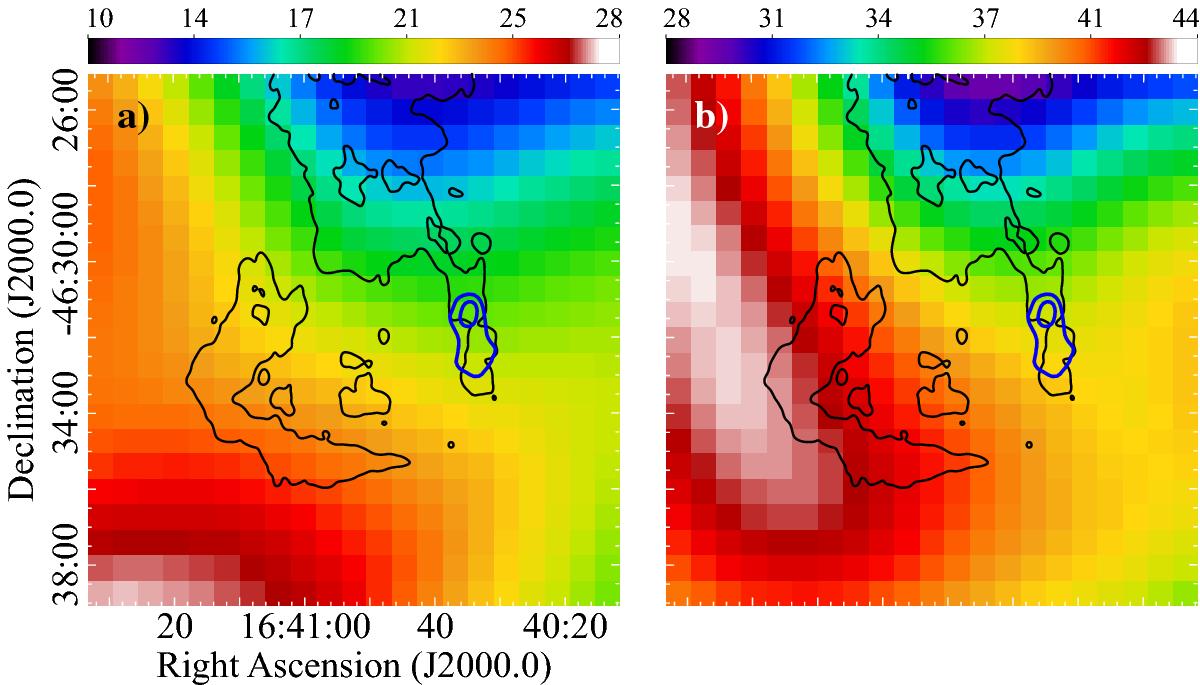
Total proton column density distribution toward G338.3−0.0, in the same velocity ranges as in Fig. 2: a) from −121 to −111 km s-1 and b) from −40 to −25 km s-1. The scale is in units of 1021 cm-2. This image was obtained by summing up the proton contributions to the total column density from the atomic and molecular species of hydrogen. The resolution is the same as the 12CO data. Black contours delineate the radio emission at 610 MHz at the same levels as in Fig. 2. Blue contours indicate the source AGAL338.307+00.006.
Current usage metrics show cumulative count of Article Views (full-text article views including HTML views, PDF and ePub downloads, according to the available data) and Abstracts Views on Vision4Press platform.
Data correspond to usage on the plateform after 2015. The current usage metrics is available 48-96 hours after online publication and is updated daily on week days.
Initial download of the metrics may take a while.