Free Access
Fig. 3
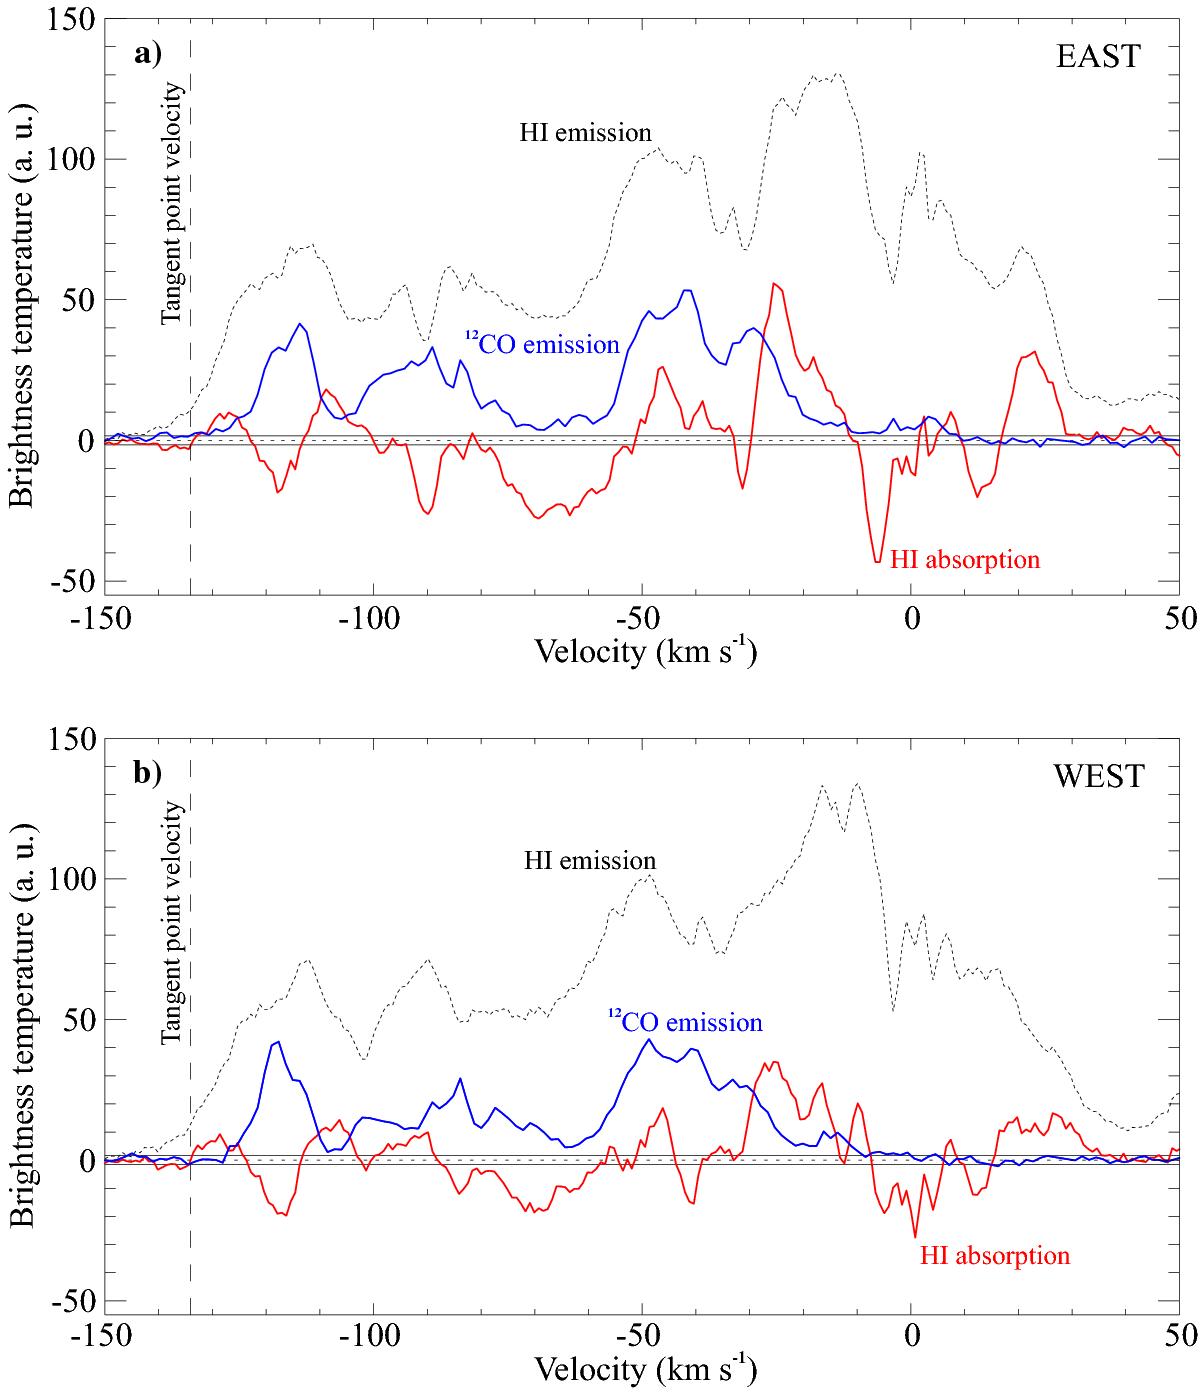
a)12CO emission spectrum (blue line) and HI emission and absorption spectra (dashed black and red line, respectively) obtained in direction to the bright eastern rim of the G338.3−0.0. b) The same as in a), toward the western rim of the remnant, where the source AGAL338.307+00.006 is located.
Current usage metrics show cumulative count of Article Views (full-text article views including HTML views, PDF and ePub downloads, according to the available data) and Abstracts Views on Vision4Press platform.
Data correspond to usage on the plateform after 2015. The current usage metrics is available 48-96 hours after online publication and is updated daily on week days.
Initial download of the metrics may take a while.