Free Access
Fig. 5
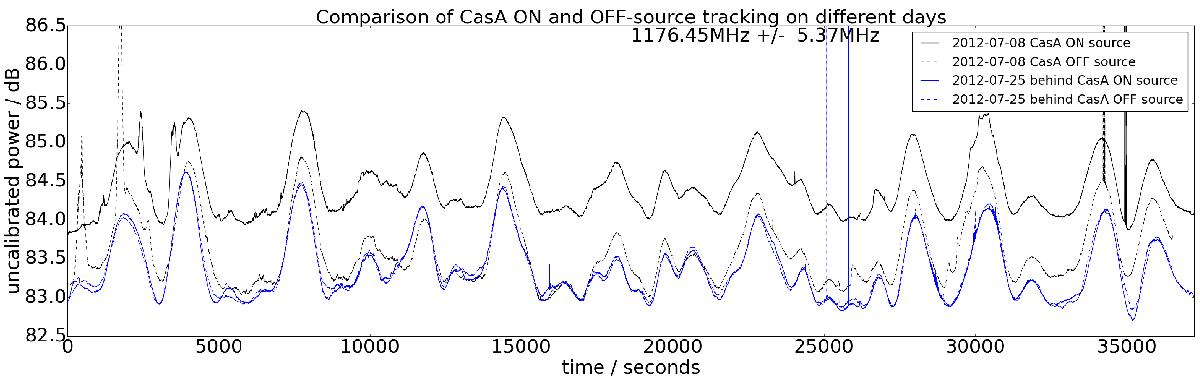
Power as a function of time while tracking Cassiopeia A, and tracking an empty sky position with the same declination. Note that the solid black line is the only on-source signal. Each tracking produces two curves due to the dual digital beams used as illustrated in Fig. 6.
Current usage metrics show cumulative count of Article Views (full-text article views including HTML views, PDF and ePub downloads, according to the available data) and Abstracts Views on Vision4Press platform.
Data correspond to usage on the plateform after 2015. The current usage metrics is available 48-96 hours after online publication and is updated daily on week days.
Initial download of the metrics may take a while.