Fig. 3
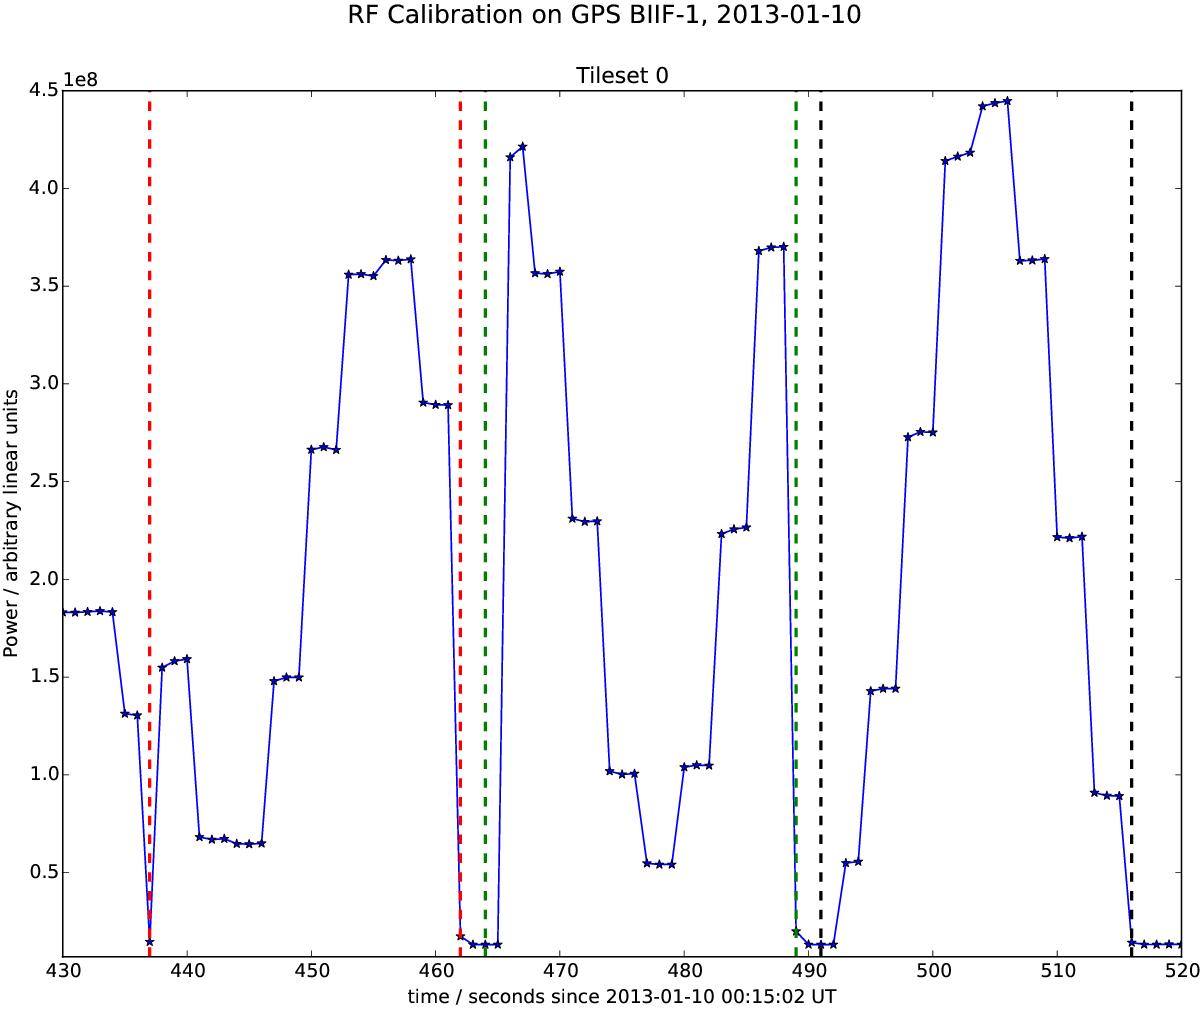
An example output of the RF calibration scheme for one tileset as described in the text. The response of tile pairs for each of the 24 phase steps applied to the second tile in the pair is shown within the three groups of vertical dashed lines. The response is clustered in groups of three corresponding to the constraint of the phase shift step size, however within each group of three there is some variation.
Current usage metrics show cumulative count of Article Views (full-text article views including HTML views, PDF and ePub downloads, according to the available data) and Abstracts Views on Vision4Press platform.
Data correspond to usage on the plateform after 2015. The current usage metrics is available 48-96 hours after online publication and is updated daily on week days.
Initial download of the metrics may take a while.