Free Access
Fig. 22
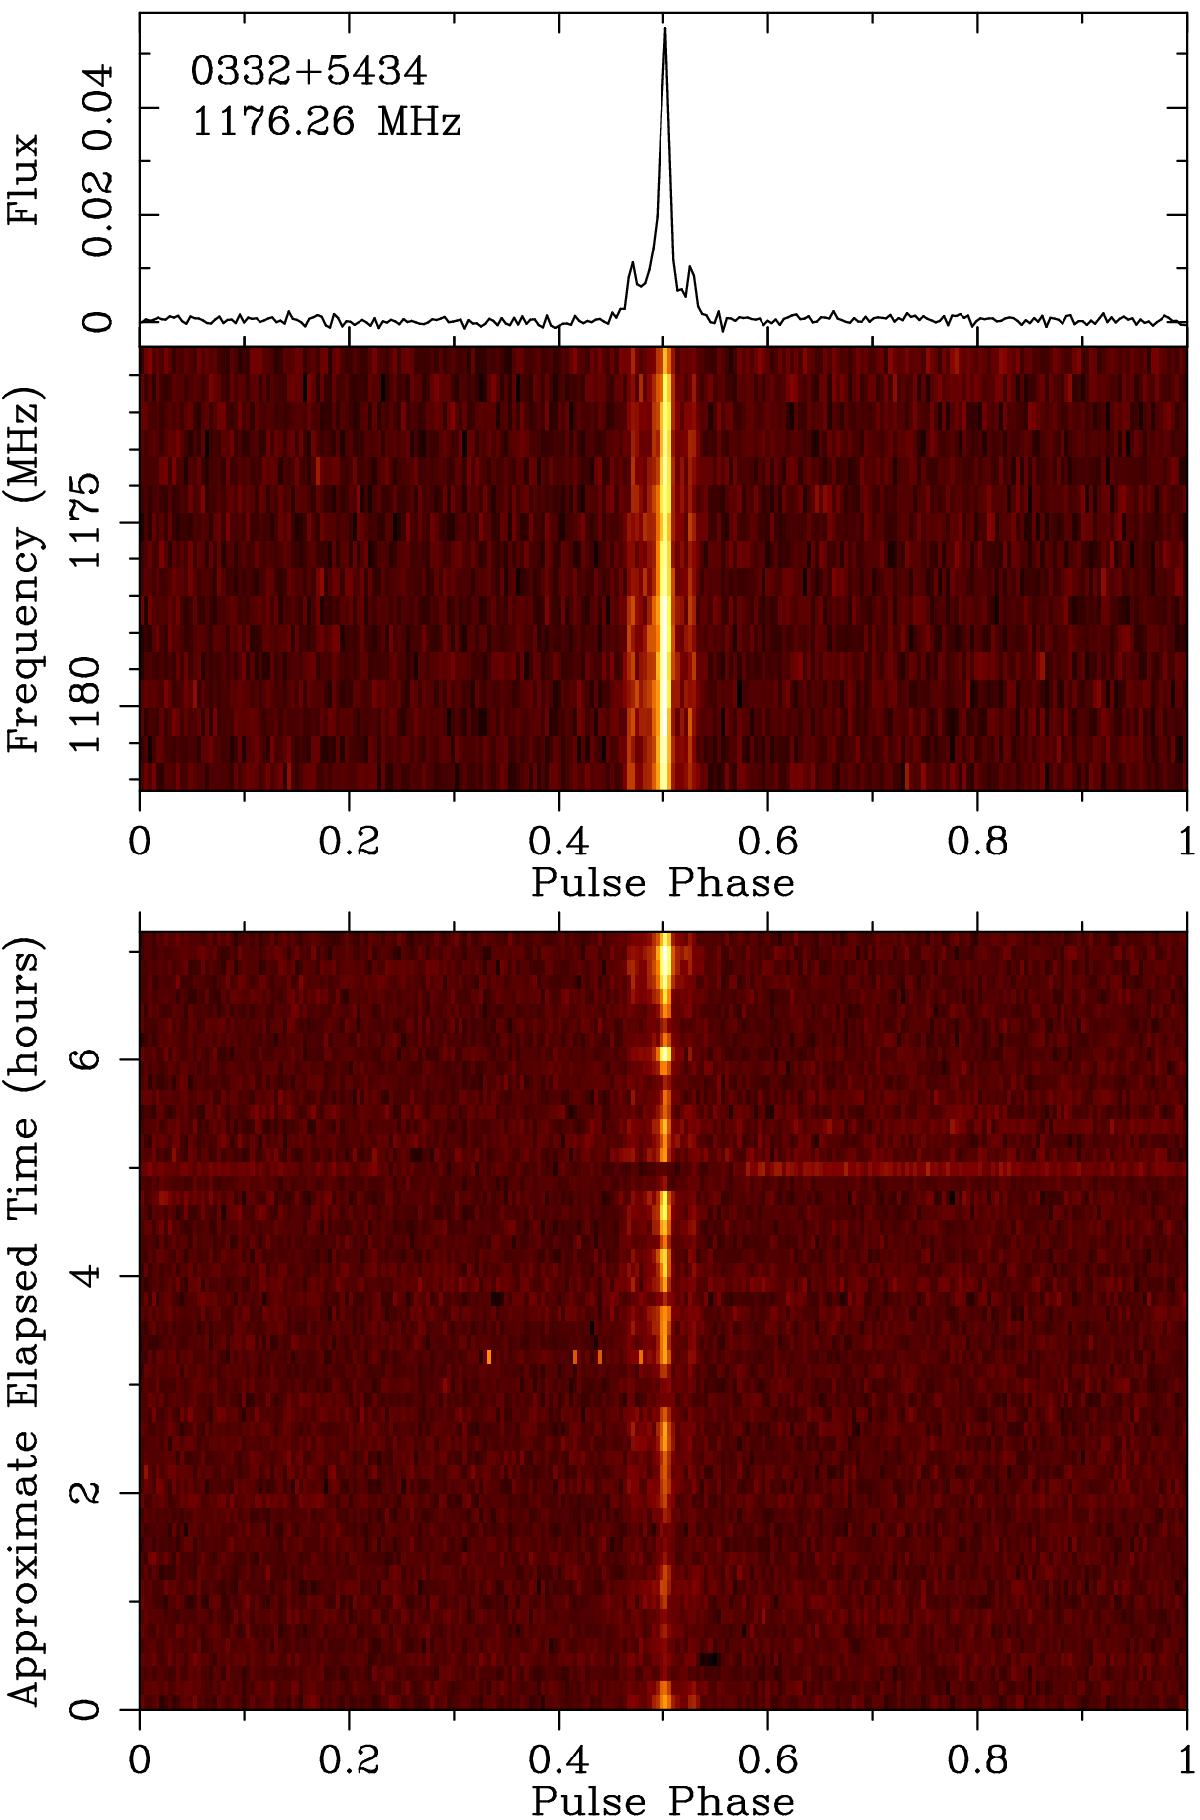
PSR B0329+54. The pulsar is detected after several minutes as shown in this dynamic plot folded at the pulsar period of 715 msec. The figure was plotted using PSRCHIVE software (Hotan et al. 2004; van Straten et al. 2012).
Current usage metrics show cumulative count of Article Views (full-text article views including HTML views, PDF and ePub downloads, according to the available data) and Abstracts Views on Vision4Press platform.
Data correspond to usage on the plateform after 2015. The current usage metrics is available 48-96 hours after online publication and is updated daily on week days.
Initial download of the metrics may take a while.